i Short answer
Fundamental analysis studies economic data, interest rate policy, and broader conditions to assess an asset's appropriate value.
Technical analysis studies price charts and historical patterns directly, largely without reference to underlying economic reasons.
📋 ON THIS PAGE
- What fundamental analysis actually involves
- Technical analysis: a brief recap of the core approach
- Key fundamental drivers particularly relevant to South African traders
- The timeframe distinction between the two approaches
- How fundamental and technical signals can conflict
- A practical approach to combining both methods
1. What fundamental analysis actually involves
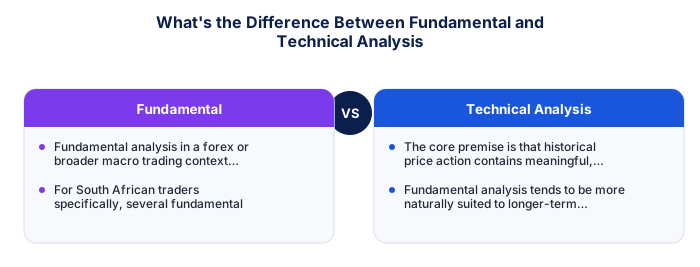
Fundamental analysis in a forex or broader macro trading context typically involves studying interest rate policy and central bank commentary, inflation and employment data, GDP growth figures, political developments, and broader macroeconomic trends to form a view on a currency's, commodity's, or index's likely directional trajectory based on underlying economic conditions rather than historical price patterns. For a stock or company-specific instrument, fundamental analysis would instead focus on company financial statements, earnings, and business-specific developments.
The underlying premise is that, over time, prices tend to reflect genuine underlying economic value and conditions, even if short-term price action can deviate from what fundamentals alone might suggest, fundamental analysis aims to identify these underlying value drivers and form a view on likely longer-term directional trajectory based on this economic reasoning.
See also: What Is an Account Base Currency and Can I Change It?
See also: How Do Political Events Affect Markets?
See also: How Do I Open a Trading Account as a South African?
See also: How Do I Evaluate Trading Podcasts and Audio Content?
See also: What Is a Trading Strategy Walk-Forward Test?
See also: What Does the Term Lot Size Mean in Forex Trading?
See also: How Does Emigration Affect My South African Trading Accou
See also: EUR/USD: Why Is It the Most Traded Pair?
See also: What Is Confirmation Bias in Trading Analysis?
See also: Is Any Currency Pegged to the Rand?
See also: What Are Common SA Trading Scams and How Do I Spot Them?
See also: How Do I Use the JSE Earnings Calendar as a Trader?
See also: How Do I Read an Economic Calendar in South African Time?
See also: Am I Ready to Start Trading? A Practical Checklist
It's worth being realistic about the depth this genuinely requires to do well. Forming a well-reasoned fundamental view isn't simply reading a single headline about an interest rate decision, it involves understanding how that decision fits within a broader policy trajectory, how it compares to what markets had already priced in as expected, and how it interacts with other simultaneous fundamental factors, a meaningfully more involved undertaking than glancing at a chart pattern.
| Feature | Fundamental Analysis | Technical Analysis |
|---|---|---|
| Focus | Economic data, news, policy | Price charts and patterns |
| Typical timeframe | Longer-term | Any, including short-term |
| Key inputs | Interest rates, GDP, employment | Indicators, support/resistance |
2. Technical analysis: a brief recap of the core approach
As discussed in more detail elsewhere on this site, technical analysis instead studies price charts, patterns, and statistical indicators directly, largely without reference to the underlying economic or fundamental reasons driving observed price movement. The core premise is that historical price action contains meaningful, at least somewhat recurring patterns reflecting aggregated market participant behaviour and psychology, providing probabilistic information useful for anticipating likely near-term price movement.
Where fundamental analysis asks "what should this asset be worth, given underlying economic conditions," technical analysis instead asks "what does the price action itself suggest about likely near-term movement, regardless of the specific underlying economic reasons."
- Quantifiable rules remove subjectivity
- Backtestable on historical data
- Works consistently when edge is genuine
- Clear entry/exit criteria reduce hesitation
- Past performance does not guarantee future results
- Risk of overfitting to historical data
- Market regimes change, edges decay
- Requires discipline through drawdown periods
- Price and volume patterns
- Works on any liquid instrument
- Faster to learn basics
- Ignores fundamental context
- Economic and financial data
- Better for longer timeframes
- Deeper knowledge required
- Ignores entry precision
Neither question is inherently more correct than the other, they're simply different lenses for approaching the same underlying uncertainty about future price movement. Many experienced traders find genuine value in holding both questions in mind simultaneously, rather than treating one as the single correct framework and dismissing the other entirely.
3. Key fundamental drivers particularly relevant to South African traders
For South African traders specifically, several fundamental factors carry particular relevance: SARB interest rate decisions and policy commentary (directly affecting Rand-related instruments, as discussed in detail regarding USD/ZAR elsewhere on this site), South African inflation and GDP growth data, global commodity price trends (given South Africa's historical resource export exposure, relevant to both the Rand broadly and the JSE Top 40 index ), and US Federal Reserve policy decisions (given the Fed's broad global influence on capital flows toward or away from emerging markets including South Africa).
Staying generally aware of scheduled fundamental data releases and policy decisions relevant to your traded instruments, using an economic calendar, Helps you anticipate periods where fundamental developments are particularly likely to drive significant price movement, potentially overriding whatever purely technical patterns might otherwise suggest in isolation.
- Written entry/exit rules with zero ambiguity
- Backtested on minimum 3 years of data
- Walk-forward tested on out-of-sample data
- SA-specific events included in test period
- Maximum drawdown within personal tolerance
- 100+ live demo trades with consistent performance
Building a simple, personal reference list of which specific releases matter most for your particular traded instruments, rather than trying to track every possible fundamental factor across every market, keeps this manageable. A trader focused primarily on USD/ZAR, for example, gets more practical value from closely tracking SARB and Fed decisions specifically than from monitoring fundamental data for markets they don't actually trade.
4. The timeframe distinction between the two approaches
Fundamental analysis tends to be more naturally suited to longer-term directional views, since underlying economic conditions typically shift gradually over weeks, months, or longer, rather than changing meaningfully within minutes or hours. Technical analysis, by contrast, can be applied across a much wider range of timeframes, from very short-term intraday charts used by day traders to longer-term weekly or monthly charts used by position traders, making it more flexibly applicable across different trading style timeframes.
This timeframe distinction is one reason many short-term, active traders lean more heavily on technical analysis for their specific entry and exit timing decisions, while still maintaining broader fundamental awareness as important background context that might occasionally override or significantly amplify what technical signals alone would suggest, particularly around major scheduled fundamental events.
| Win rate | 1:1 RR | 1.5:1 RR | 2:1 RR |
|---|---|---|---|
| 40% | Losing | Break even | Profitable |
| 50% | Break even | Profitable | Profitable |
| 55% | Profitable | Profitable | Profitable |
| 60% | Profitable | Profitable | Profitable |
This doesn't mean fundamental analysis is irrelevant to short-term trading, quite the opposite around scheduled announcements specifically, it means fundamental analysis's natural strength lies in answering 'which broad direction, over weeks or months' rather than 'should I enter in the next five minutes,' a distinction worth keeping clear when deciding how much weight to give each approach for a specific trading decision.
5. How fundamental and technical signals can conflict
It's entirely possible, and indeed common, for technical and fundamental analysis to suggest different or even directly conflicting conclusions about likely near-term price direction for the same instrument at the same time, for example, a technical chart pattern might suggest an instrument is due for a short-term bounce, while underlying fundamental conditions might suggest a longer-term bearish trajectory remains intact despite this anticipated short-term technical bounce.
managing these apparent conflicts requires a clear, predetermined framework for how you'll weigh and prioritise each type of signal, some traders give fundamental analysis priority for longer-term directional bias while using technical analysis specifically for shorter-term entry and exit timing within that broader fundamental view, while others lean much more heavily toward technical signals alone, treating fundamental awareness mainly as a risk-management input (knowing when to be more cautious around major scheduled fundamental events) rather than a primary directional signal in its own right.
There's no single objectively correct way to resolve this tension, different approaches suit different trading styles and philosophies genuinely well. What matters more than which specific framework you adopt is having decided on your approach in advance, during calm, deliberate planning, rather than working it out inconsistently in the moment each time a genuine conflict between the two signal types actually arises.
6. A practical approach to combining both methods
A practical, commonly used combined approach involves using fundamental analysis to establish a broader directional bias or context (is the underlying economic environment generally favourable or unfavourable for this specific instrument over the medium term), then using technical analysis specifically to identify more precise entry and exit timing and price levels within that broader fundamental context, rather than treating either approach as a complete, standalone trading methodology in isolation.
This combined approach also supports better risk management around scheduled fundamental events, recognising that a strong, clear technical setup might still be overridden or disrupted by an imminent major fundamental announcement is valuable risk-awareness that a purely technical approach, considered entirely in isolation without any fundamental awareness, might miss entirely.
Technical analysis examines price charts to time entries and exits.
Fundamental analysis examines macroeconomic drivers, news, and data to understand why price should move. Technical analysis reads charts to time when to enter and exit. Both are most powerful when used together.
★ Why It Matters
Worth testing directly: take a position based purely on fundamental reasoning, then separately mark where a technical analyst would place entry and exit on the same chart, comparing these two independently-derived views on the same trade often reveals where your own analysis has blind spots.
✕ Common mistakes
- Assuming these two approaches always agree with each other. Genuine divergence between them is common and worth understanding rather than ignoring.
- Not considering how combining both might address each one's individual weaknesses. Many traders find value in using both rather than choosing one exclusively.
- Treating one approach as definitively superior without testing for your own specific style. Personal fit and testing matter more than general claims about either approach.
Key Takeaways
- Fundamental analysis studies economic data and value; technical analysis studies price charts and patterns. Learn how South African traders combine both.
- Fundamental analysis studies economic data, interest rate policy, and broader conditions to assess an asset's appropriate value.
- Technical analysis studies price charts and historical patterns directly, largely without reference to underlying economic reasons.
- What fundamental analysis actually involves.
- Technical analysis: a brief recap of the core approach.
Frequently asked follow-up questions
Is one approach generally considered better than the other?
Neither is universally superior; many genuinely successful traders use elements of both, and the right balance depends significantly on individual trading style, timeframe, and specific instruments traded.
Can beginners start with just technical analysis and add fundamentals later?
Yes, this is a common, reasonable learning progression, building core technical analysis skills first, then gradually incorporating broader fundamental awareness as experience and understanding develop further.
Does fundamental analysis matter for very short-term day trading?
Even short-term day traders benefit from awareness of scheduled major fundamental events specifically to avoid unexpected volatility around these releases, even if their actual entry and exit decisions rely primarily on technical analysis.
