i Short answer
Technical analysis studies historical price charts, patterns, and indicators like RSI, MACD, and moving average crossovers like the golden cross to inform trading decisions about likely future price movement.
It works imperfectly: it offers a structured decision-making framework, but doesn't reliably predict the future with certainty.
📋 ON THIS PAGE
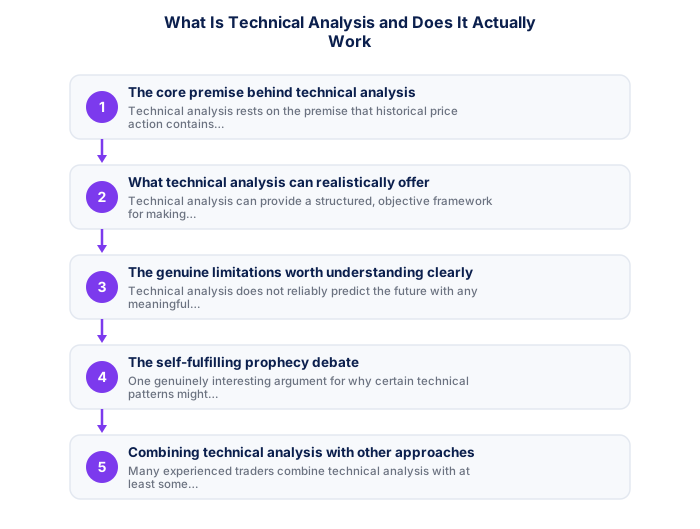
- The core premise behind technical analysis
- What technical analysis can realistically offer
- The genuine limitations worth understanding clearly
- The self-fulfilling prophecy debate
- Combining technical analysis with other approaches
- How to evaluate whether it's working for you specifically
- What technical analysis cannot tell you about the rand
1. The core premise behind technical analysis
Technical analysis rests on the premise that historical price action contains meaningful patterns reflecting the aggregated behaviour and psychology of market participants, and that certain patterns tend to recur with at least some statistical regularity, providing a probabilistic (not certain) edge in anticipating likely future price movement. This contrasts with fundamental analysis, which instead focuses on underlying economic, financial, or company-specific data to form a view on an asset's appropriate value.
The premise doesn't claim that charts perfectly predict the future, rather, that certain recurring patterns in price behaviour, volume, and momentum provide useful, if imperfect, probabilistic information that, combined with disciplined risk management, can inform a workable trading approach over a large enough sample of trades.
It's worth being precise about what 'probabilistic edge' actually means here: a genuine edge shifts the odds slightly in your favour over a large number of repeated applications, it doesn't make any individual trade's outcome predictable. Treating a specific pattern as a near-certain signal, rather than a modest statistical tilt, is one of the more common ways traders misapply technical analysis relative to what its underlying premise actually supports.
2. What technical analysis can realistically offer
Technical analysis can provide a structured, objective framework for making trading decisions, reducing reliance on pure gut feeling or emotional reaction. It can help identify potential support and resistance levels where price has historically reversed or paused, momentum indicators that flag when a price move might be losing strength, and chart patterns that some traders find correlate with subsequent price behaviour with at least some consistency across a large enough sample.
Importantly, this structured framework also supports clearer risk management, defining specific entry, stop-loss, and target levels based on technical analysis gives concrete, predetermined decision points, rather than leaving these critical choices to be made reactively and emotionally in the moment, which is itself one of the most practically valuable contributions technical analysis makes regardless of how reliably any specific pattern actually predicts future price movement.
- Quantifiable rules remove subjectivity
- Backtestable on historical data
- Works consistently when edge is genuine
- Clear entry/exit criteria reduce hesitation
- Past performance does not guarantee future results
- Risk of overfitting to historical data
- Market regimes change, edges decay
- Requires discipline through drawdown periods
- Price and volume patterns
- Works on any liquid instrument
- Faster to learn basics
- Ignores fundamental context
- Economic and financial data
- Better for longer timeframes
- Deeper knowledge required
- Ignores entry precision
This structure also creates something genuinely useful beyond the individual trade decision: a consistent, repeatable process you can review afterward. Because technical analysis produces specific, definable reasons for each entry and exit, your trading journal can capture exactly what the chart showed at the time, making honest review of what worked and what didn't considerably more precise than trying to reconstruct a purely intuitive decision after the fact.
3. The genuine limitations worth understanding clearly
Technical analysis does not reliably predict the future with any meaningful certainty, and different traders analysing the identical chart frequently reach different, sometimes contradictory conclusions, reflecting technical analysis's inherently somewhat subjective and interpretive nature despite its quantitative-seeming tools and indicators. Markets are also influenced by genuinely unpredictable factors, surprise news events, shifts in fundamental conditions, broader macroeconomic developments, that no amount of historical price pattern analysis can anticipate.
Academic research on technical analysis's effectiveness has produced mixed results over many decades of study, with some research suggesting certain specific approaches show modest, statistically detectable edges in certain conditions, while other research finds limited support for many widely popular technical analysis claims once rigorous statistical testing is applied, this mixed evidence base is worth holding in mind rather than assuming technical analysis is either a reliably proven science or entirely without any merit.
- Written entry/exit rules with zero ambiguity
- Backtested on minimum 3 years of data
- Walk-forward tested on out-of-sample data
- SA-specific events included in test period
- Maximum drawdown within personal tolerance
- 100+ live demo trades with consistent performance
This subjectivity is worth demonstrating to yourself directly rather than simply accepting as an abstract claim. Pulling up the same chart a week apart, without reference to your earlier analysis, and seeing whether you draw the identical trend lines or identify the identical support level both times is a humbling but genuinely useful exercise for calibrating how much certainty any single technical read actually deserves.
4. The self-fulfilling prophecy debate
One genuinely interesting argument for why certain technical patterns might have at least some real predictive value, beyond simply reflecting underlying market psychology, is the self-fulfilling prophecy effect: if enough market participants widely recognise and act on a specific pattern (for example, a commonly watched support level), their collective buying or selling at that level can itself help produce the very price behaviour the pattern "predicted," simply because enough traders are acting on the same signal simultaneously.
This effect is most plausible for widely-followed, simple technical levels and patterns that a large proportion of market participants are likely watching simultaneously, and becomes progressively less plausible for more obscure, complex, or less widely recognised technical indicators that fewer traders are likely tracking or acting upon in any coordinated way.
| Win rate | 1:1 RR | 1.5:1 RR | 2:1 RR |
|---|---|---|---|
| 40% | Losing | Break even | Profitable |
| 50% | Break even | Profitable | Profitable |
| 55% | Profitable | Profitable | Profitable |
| 60% | Profitable | Profitable | Profitable |
This has a practical implication worth acting on: all else equal, technical levels and patterns that appear on the default settings of widely-used charting platforms, the ones a large share of retail and even some institutional traders are likely watching, probably deserve somewhat more weight in your analysis than a highly customised, unusual indicator combination that only you and a small handful of other traders are likely to be tracking.
5. Combining technical analysis with other approaches
Many experienced traders combine technical analysis with at least some awareness of fundamental and macro factors specifically relevant to their traded instruments, for example, a technical setup on USD/ZAR might be weighted differently depending on whether a major SARB announcement or significant global risk event is imminent, since these fundamental factors can override or significantly amplify whatever a purely technical pattern might otherwise suggest in isolation.
This combined approach, using technical analysis for specific entry and exit timing and risk management structure, while maintaining broader awareness of fundamental and macro context that might override or reinforce technical signals, is widely considered more sound than relying exclusively on either technical or fundamental analysis alone, without any reference to the other.
This doesn't require becoming a fundamental analyst in parallel with being a technical trader. Even a basic awareness of when major scheduled events are due, and a willingness to apply extra caution or reduce position size around them regardless of how clean the technical setup looks, captures much of the practical benefit of this combined approach without requiring deep fundamental expertise.
6. How to evaluate whether it's working for you specifically
Given the genuinely mixed broader evidence on technical analysis's general effectiveness, the most useful practical approach is rigorously testing your own specific technical analysis approach against your own actual trading results over a meaningful sample size, rather than assuming any widely popular technique will automatically work well for you . This means maintaining a disciplined trade journal, specifically tracking which technical signals you're using and how they actually perform across enough trades to draw statistically meaningful conclusions.
This personal, rigorous testing approach, rather than simply trusting that a popular indicator or pattern "works" because it's widely discussed in trading education content, is ultimately the only reliable way to determine whether your specific implementation of technical analysis is genuinely contributing positively to your trading results, or whether it's providing a false sense of structure and confidence without actually improving your real decision-making and outcomes.
In thin, manipulated markets its reliability drops significantly.
Technical analysis works better in liquid markets with a consistent participant base, partly because widely-watched patterns become self-fulfilling. In thin or manipulated markets, its reliability drops significantly.
★ Why It Matters
Worth treating as a personal experiment rather than accepting blanket claims either way: backtest your own specific technical setup against your own specific instrument and timeframe, technical analysis's effectiveness appears to vary enough by context that broad statements about whether 'it works' aren't very actionable on their own.
✕ Common mistakes
- Not backtesting your own specific setup on your own specific instrument. This personal test is more useful than any general statistic about technical analysis.
- Assuming a technique that works on one instrument transfers directly to another. Reliability appears to vary meaningfully across different markets.
- Treating technical analysis as a certainty rather than a structured decision framework. It informs probability, not guaranteed prediction.
7. What technical analysis cannot tell you about the rand
Chart analysis assumes prices move continuously through levels. Rand pairs regularly violate that assumption in two specific ways, and both defeat technical levels rather than testing them.
The first is scheduled events. SARB rate decisions land at 15:00 SAST, South African CPI in the local morning, and major US releases in the early afternoon. Price frequently jumps straight through a level that looked solid on the chart, because the level was never the thing setting the price. The second is weekend gaps: the market closes around midnight on Friday SAST and reopens Sunday evening, and local political or ratings news breaking in between produces an opening price with no path between it and Friday's close. Support and resistance drawn across that gap describe a price range that never traded. What drives the rand covers which events matter most, and the session map in SAST covers when they land.
Key Takeaways
- Technical analysis studies price charts to predict future movement. It works imperfectly and inconsistently, learn what it can and can't realistically do.
- Technical analysis studies historical price charts, patterns, and indicators to inform trading decisions about likely future price movement.
- It works imperfectly: it offers a structured decision-making framework, but doesn't reliably predict the future with certainty.
- The core premise behind technical analysis.
- What technical analysis can realistically offer.
Frequently asked follow-up questions
Is technical analysis the same as charting?
Charting is the visual tool used to display price data; technical analysis is the broader practice of interpreting that displayed data using various patterns, indicators, and analytical frameworks.
Do professional institutional traders use technical analysis?
Many do, often alongside fundamental analysis and other quantitative approaches, though the specific weight given to technical analysis varies considerably across different institutional trading strategies and firms.
Can technical analysis predict major news-driven price moves?
No, technical analysis based on historical price patterns generally cannot anticipate the content or timing of genuinely surprising news events, which is one of its clearest and most important limitations.
