i Short answer
The Ichimoku Cloud combines several components into one indicator showing trend direction, momentum, and support and resistance simultaneously.
It has a genuine learning curve, making it more suited to traders willing to invest meaningful time.
📋 ON THIS PAGE
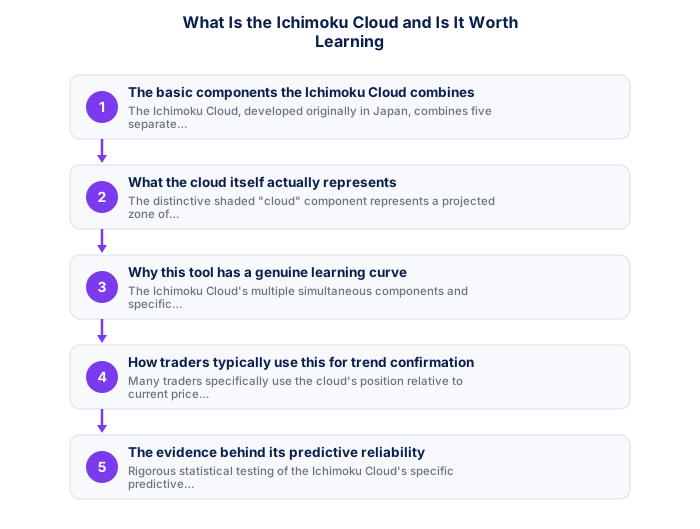
1. The basic components the Ichimoku Cloud combines
The Ichimoku Cloud, developed originally in Japan, combines five separate calculated lines into a single visual chart overlay, including components reflecting short and longer-term price averages, a leading projection of future support and resistance, and a lagging confirmation line, all displayed together.
It's worth appreciating why this indicator combines several elements into a single visual system, rather than treating each moving average and line separately, the intended value lies specifically in how these components work together, similar to the confluence principle discussed elsewhere on this site.
See also: What Is Confirmation Bias in Trading Analysis?
See also: How Do I Evaluate Trading Courses With Certificates?
2. What the cloud itself actually represents
The distinctive shaded "cloud" component represents a projected zone of potential future support and resistance, with price trading above, below, or within this cloud carrying different interpretive significance for the indicator's users.
It's worth studying historical examples of this cloud visually before attempting to trade with it live, building genuine familiarity with how the cloud's shape and colour shifts correspond to actual price behaviour takes deliberate, repeated chart practice.
- FSCA-regulated broker verified at fsca.co.za
- Demo account tested for minimum 60 days
- Trading plan written: entry, exits, position sizing
- Risk per trade defined (1-2% of account)
- Backup internet connection tested for load shedding
- Tax implications understood
3. Why this tool has a genuine learning curve
As, the Ichimoku Cloud's multiple simultaneous components and specific interpretive rules genuinely require more dedicated learning investment than simpler, single-purpose indicators, making it less immediately accessible for complete beginners.
It's worth being honest with yourself about the time investment this specific indicator demands, discussed elsewhere on this site regarding realistic learning timelines, Ichimoku genuinely requires more dedicated study than simpler, single-line indicators before you can apply it confidently.
4. How traders typically use this for trend confirmation
Many traders specifically use the cloud's position relative to current price as a trend confirmation tool, price trading above the cloud suggesting a bullish bias, below suggesting bearish, sometimes combined with the other component lines for additional confirmation, similar in spirit to the confluence concept.
It's worth backtesting your specific Ichimoku-based entry criteria thoroughly, discussed elsewhere on this site regarding backtesting generally, before relying on this multi-component system for live trading decisions.
| Item | Detail |
|---|---|
| Regulator | FSCA, fsca.co.za |
| Exchange control | SARB, resbank.co.za |
| Tax authority | SARS, sars.gov.za |
| JSE hours | 09:00-17:00 SAST Mon-Fri |
| Best forex session | 15:00-17:00 SAST |
| CGT annual exclusion | R50,000 (individuals) |
5. The evidence behind its predictive reliability
Rigorous statistical testing of the Ichimoku Cloud's specific predictive reliability has produced genuinely mixed results, similar to the broader pattern.
It's worth applying the same evidence-based scepticism discussed throughout this site's technical analysis content specifically to Ichimoku, its considerable visual complexity doesn't automatically confer superior predictive reliability compared to simpler, more established tools.
One of the most common mistakes among new traders in South Africa is underestimating the learning period required before live trading becomes appropriate. Most successful retail traders report spending six months to two years on education, demo trading, and small-account live trading before reaching any form of consistency. This investment of time before scaling up capital is not a barrier to entry but a risk management practice that protects capital from being lost during the steepest part of the learning curve.
6. Deciding whether this is worth your learning investment
Given the genuine learning curve, this tool suits traders specifically interested in investing the time to understand its multiple components thoroughly, while traders preferring simpler, more immediately accessible tools might reasonably find better value focusing on the more straightforward concepts instead.
The quality of trading education available to South African traders has improved substantially with the growth of FSCA-regulated broker educational content and global online resources. The critical evaluation skill, separating genuinely educational content from thinly disguised marketing for signals, courses, or investment schemes, is as important as the content itself. South African traders should additionally prioritise educational resources that address SA-specific topics including ZAR trading dynamics, SARB policy implications, FSCA regulatory requirements, and SARS tax treatment, since virtually all internationally produced trading education was created without these local dimensions in mind.
The transition from demo to live trading is one of the most psychologically significant steps in a trader's development, and the gap between demo performance and early live performance is a well-documented phenomenon. The primary driver is emotional: real capital at risk changes decision-making in ways that are invisible during demo trading. Common manifestations include premature exit from winning positions to lock in profit, reluctance to enter valid setups due to fear, and difficulty accepting losses that felt mechanical on demo but feel painful with real money. The practical solution is to start live trading with an amount small enough that the monetary amounts do not produce strong emotional reactions while still requiring genuine real-money decision-making. Starting with one to three months of discretionary income is a useful benchmark for calibrating this initial live capital.
As a standalone entry signal it adds complexity without proportionate reliability.
Ichimoku provides rich trend context by showing multiple timeframes of support, resistance, momentum, and cloud direction simultaneously. As a standalone entry signal it adds significant complexity without proportionate improvement.
Evaluating trading educational content requires applying the same critical standards you would apply to any financial information source. The most valuable resources are those that focus on process, risk management, and psychological frameworks rather than those that primarily promise profits or specific returns. South African traders should additionally prioritise content that addresses SA-specific regulatory, tax, and market context, since most international trading education was produced without South African exchange control, SARS tax treatment, or ZAR-specific market conditions in mind.
★ Why It Matters
Worth trying as a specific, lower-commitment first step: use just the cloud component alone for a few weeks before adding the indicator's other lines, traders sometimes find the simplified version captures most of the practical value without requiring mastery of the full, more complex system immediately.
✕ Common mistakes
- Assuming this indicator suits every trading style equally. Its complexity and learning curve suit some approaches more than others.
- Not testing the simplified version before committing to the full system. This staged approach captures much of the practical value with less initial investment.
- Treating this indicator as a complete strategy on its own. It tends to work best combined with broader analysis rather than used in isolation.
Key Takeaways
- The Ichimoku Cloud combines several components into one indicator showing trend, momentum, and support and resistance, though it has a genuine learning curve.
- The Ichimoku Cloud combines several components into one indicator showing trend direction, momentum, and support and resistance simultaneously.
- It has a genuine learning curve, making it more suited to traders willing to invest meaningful time.
- The basic components the Ichimoku Cloud combines.
- What the cloud itself actually represents.
See also: What Is a Golden Cross and Death Cross in Trading? and What Is MACD and How Do Traders Use It?.
Frequently asked follow-up questions
Is the Ichimoku Cloud suitable for complete beginners?
Given its genuine learning curve, many educators suggest beginners first build foundational understanding with simpler tools before tackling this more complex, multi-component indicator.
Can this tool be used across all timeframes?
Yes, the same underlying calculation applies across different timeframes, though specific interpretation may benefit from considering the broader trend context.
Does the Ichimoku Cloud work better for certain instruments than others?
Some traders find this tool particularly suited to trending instruments rather than genuinely range-bound markets, though this varies by specific market conditions rather than a fixed, universal rule.
Is this indicator available on most standard trading platforms?
Yes, this is a widely available indicator included in most major charting platforms, without typically requiring any additional installation.
Should I combine this with other indicators or use it standalone?
Many traders do combine this with additional confirmation tools, though some specifically use it as a relatively self-contained, standalone analytical framework.
