i Short answer
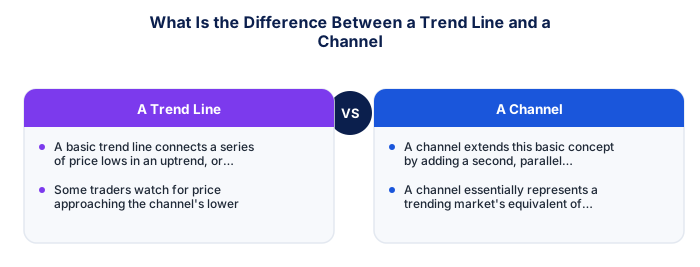
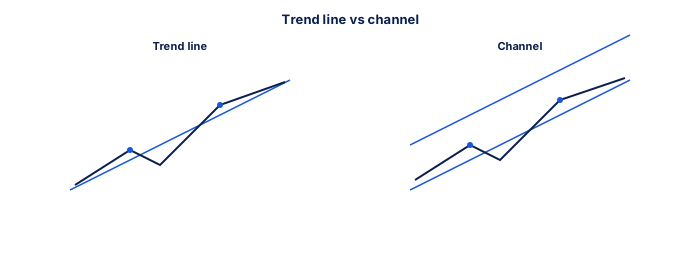
A trend line connects price points along one direction to identify the prevailing trend.
A channel adds a second, parallel line creating a bounded zone traders watch for entry and exit opportunities.
📋 ON THIS PAGE
1. Drawing a basic trend line explained
A basic trend line connects a series of price lows in an uptrend, or a series of price highs in a downtrend, providing a simple visual representation of the prevailing trend's general direction and approximate angle of ascent or descent over the period being analysed.
It's worth requiring genuinely two or more touches before treating a trend line as meaningful, similar to the standard discussed elsewhere on this site regarding support and resistance levels, a line connecting only a single point and an assumed direction is far less reliable than one confirmed by multiple genuine touches.
| Feature | Trend Line | Channel |
|---|---|---|
| Lines drawn | One | Two, parallel |
| What it shows | Direction of the prevailing trend | A bounded zone price tends to move within |
| Typical use | Confirming trend direction and slope | Identifying potential entry/exit zones at boundaries |
| Minimum touches for validity | Two or more | Two or more per line |
| Relates to | Basic trend identification | Range trading, discussed elsewhere on this site |
| Subjectivity involved | Moderate | Higher, given two lines to place |
2. Extending this into a full channel
A channel extends this basic concept by adding a second, parallel line on the opposite side of price action, connecting the highs in an uptrend channel, or the lows in a downtrend channel, creating a bounded zone within which price has historically tended to oscillate while the broader trend continues.
See also: What Is Confirmation Bias in Trading Analysis?
It's worth practising drawing channels on historical charts deliberately, discussed elsewhere on this site regarding chart practice generally, building genuine comfort with identifying parallel boundaries takes repeated, deliberate practice rather than coming naturally from the outset.
- FSCA-regulated broker verified at fsca.co.za
- Demo account tested for minimum 60 days
- Trading plan written: entry, exits, position sizing
- Risk per trade defined (1-2% of account)
- Backup internet connection tested for load shedding
- Tax implications understood
3. How traders typically use channel boundaries
Some traders watch for price approaching the channel's lower boundary in an uptrend as a potential buying opportunity, anticipating a bounce back toward the upper boundary, and the upper boundary as a potential area to take profit or consider a short-term pullback, similar in underlying logic to range trading, just applied within a broader trending context rather than a purely sideways market.
It's worth treating a channel the same way you would standard support and resistance, discussed elsewhere on this site, requiring genuine confirmation at each boundary before acting, rather than anticipating a bounce purely because price is approaching the drawn line.
4. The connection to range trading
A channel essentially represents a trending market's equivalent of the support and resistance boundaries that define a genuine trading range, with the key distinction being the channel's overall slope reflecting the underlying trend direction, rather than the purely horizontal boundaries a non-trending range typically shows.
It's worth recognising a channel as essentially range trading's sloped equivalent, discussed elsewhere on this site regarding range trading specifically, the same underlying principles and risks apply, just adapted to a trending rather than purely horizontal price structure.
| Item | Detail |
|---|---|
| Regulator | FSCA, fsca.co.za |
| Exchange control | SARB, resbank.co.za |
| Tax authority | SARS, sars.gov.za |
| JSE hours | 09:00-17:00 SAST Mon-Fri |
| Best forex session | 15:00-17:00 SAST |
| CGT annual exclusion | R50,000 (individuals) |
5. The genuine subjectivity in drawing these lines
Like other subjective technical analysis tools, drawing trend lines and channels involves genuine judgement about which specific price points to connect, meaning different traders analysing the identical chart can sometimes draw meaningfully different lines, the same kind of interpretive variability that shows up with other subjective technical tools.
It's worth being consistent in your own specific approach to drawing these lines, discussed elsewhere on this site regarding the broader subjectivity challenge in technical analysis, applying the same criteria consistently across different charts matters more than achieving some theoretically perfect, objective line placement.
6. What happens when price breaks out of a channel
Price eventually breaking decisively beyond either channel boundary often signals a potential significant shift in the prevailing trend's strength or direction. Traders sometimes specifically watch for this kind of channel breakout as a distinct trading signal, separate from the within-channel boundary-bouncing approach covered above.
However you decide, the distance should come from the instrument rather than from a round figure. volatility
Channels offer both a boundary to trade from and a breakout to watch.
A trend line defines the overall directional bias. A channel adds a parallel line to define the range within that trend, allowing both boundary entries when price reaches either line and a breakout watch when it exits.
★ Why It Matters
Worth testing on your own charts: draw a channel using only the first half of a trend's price history, then check whether the second half stayed within those original boundaries. This retrospective check reveals how reliably channels actually project forward versus only fitting cleanly in hindsight.
✕ Common mistakes
- Drawing trend lines and channels inconsistently between charts. Inconsistent anchor points produce unreliable, hard-to-replicate levels.
- Assuming a channel will continue holding indefinitely once established. Channels eventually break, and treating them as permanent invites poor risk management.
- Forcing a channel onto price action that doesn't genuinely fit it. A channel should emerge from the data, not be imposed onto it.
Key Takeaways
- A trend line connects price points along one direction, while a channel adds a second, parallel line creating bounded zones traders watch for entries and exits.
- A trend line connects price points along one direction to identify the prevailing trend.
- A channel adds a second, parallel line creating a bounded zone traders watch for entry and exit opportunities.
- Drawing a basic trend line explained.
- Extending this into a full channel.
See also: What Is Range Trading and How Does It Relate to Day Trading? and What Is the Difference Between a Breakout and a Fakeout? and What Is a Golden Cross and Death Cross in Trading? and What Is MACD and How Do Traders Use It?.
Frequently asked follow-up questions
Do channels work the same way across all timeframes?
The same underlying concept applies across timeframes, though specific channel boundaries will naturally differ between shorter and longer timeframe charts.
Should I always expect price to respect channel boundaries?
No. Channels represent historical tendency rather than a guaranteed, mechanical rule; price can and does eventually break out of established channels.
Is channel trading the same as Elliott Wave theory?
No, these are distinct concepts. Channels are a more straightforward, visual trend-boundary tool, while Elliott Wave proposes a more complex underlying wave structure theory.
