i Short answer
The JSE is Africa's largest stock exchange by market capitalisation, though considerably smaller than major global exchanges like the NYSE or NASDAQ.
This reflects South Africa's position as a significant but smaller emerging market.
📋 ON THIS PAGE
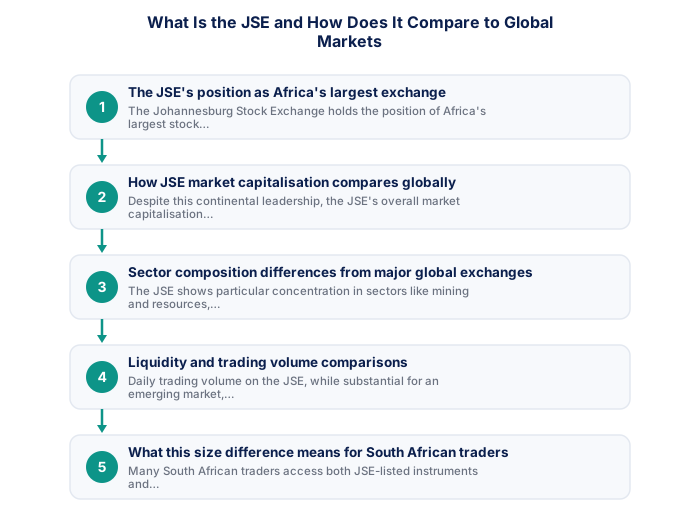
- The JSE's position as Africa's largest exchange
- How JSE market capitalisation compares globally
- Sector composition differences from major global exchanges
- Liquidity and trading volume comparisons
- What this size difference means for South African traders
- The JSE's broader significance despite its relative size
1. The JSE's position as Africa's largest exchange
The Johannesburg Stock Exchange holds the position of Africa's largest stock exchange by market capitalisation, hosting numerous significant South African companies alongside some listings from elsewhere on the continent, reflecting South Africa's position as the continent's most developed capital market.
This continental leadership matters for more than just headline ranking. It means the JSE genuinely functions as the primary gateway for capital flowing into and out of African equity markets more broadly, and its listing standards, disclosure requirements, and market infrastructure are generally regarded as considerably more developed than those of most other African exchanges, giving it a credibility advantage that attracts both domestic and international investor participation.
2. How JSE market capitalisation compares globally
Despite this continental leadership, the JSE's overall market capitalisation remains considerably smaller than major global exchanges like the New York Stock Exchange or NASDAQ, reflecting the broader size difference between South Africa's economy and the largest global economies.
To put this in perspective, the combined market capitalisation of a handful of the largest individual companies listed on NASDAQ can exceed the JSE's entire market capitalisation. This isn't a criticism of the JSE's quality or function, it's simply a reflection of the scale gap between South Africa's economy and the world's largest developed economies, and it's worth keeping this context in mind when comparing index movements or headline figures across exchanges.
See also: How Does SA Land Reform Affect Investor Sentiment?
See also: How Does SA's February Tax Year-End Affect Markets?
See also: EUR/USD: Why Is It the Most Traded Pair?
See also: How Does the Mining Charter Affect JSE Mining Shares?
- SARB economic calendar checked for the week
- Next Eskom load shedding schedule reviewed
- GNU stability news reviewed
- Stats SA data releases noted
- Credit agency review dates checked
- US/global events that move EM risk noted
3. Sector composition differences from major global exchanges
The JSE shows particular concentration in sectors like mining and resources, reflecting South Africa's specific economic structure, differing somewhat from the technology-heavy composition of exchanges like NASDAQ.
This concentration has a practical consequence worth understanding: JSE index performance tends to be more sensitive to global commodity price cycles than a more diversified, technology-weighted index would be. A period of strong gold or platinum prices can lift the JSE meaningfully even when broader global equity sentiment is only modestly positive, while commodity weakness can weigh on JSE performance even during periods of general global market strength.
| Event | Frequency | ZAR impact | Source |
|---|---|---|---|
| SARB MPC | 6x per year | High | resbank.co.za |
| Budget Speech | Annual (February) | Very high | treasury.gov.za |
| Credit reviews | Annual each agency | Very high | Agency sites |
| Stats SA CPI | Monthly | Medium | statssa.gov.za |
| Eskom stage | As needed | Low-medium | eskomsepush.com |
- SA context provides genuine informational edge
- ZAR pairs accessible via FSCA brokers in ZAR accounts
- Rand volatility creates larger intraday ranges
- 6 SARB meetings/year create regular macro setups
- Higher geopolitical risk than G10 pairs
- Load shedding creates unique operational disruptions
- SA rand liquidity thinner than major G10 pairs
- SA-specific news requires constant local monitoring
4. Liquidity and trading volume comparisons
Daily trading volume on the JSE, while substantial for an emerging market, remains considerably lower than the major global exchanges, meaning some individual JSE-listed shares may show less liquidity than comparable large-cap shares on bigger exchanges.
This liquidity difference matters practically for anyone trading JSE-listed instruments through CFDs specifically, since lower liquidity on the underlying market can translate into somewhat wider spreads and less consistently tight execution compared to trading a heavily-traded major index or share, worth factoring into position sizing and order type decisions for JSE-linked instruments.
5. What this size difference means for South African traders
Many South African traders access both JSE-listed instruments and international markets, rather than limiting themselves exclusively to either market, often through a combination of direct share trading, ETFs, or unit trusts.
This blended approach lets a trader capture genuine local market exposure and familiarity, including a more intuitive feel for how domestic news and SARB policy affect JSE-linked instruments specifically, while also accessing the deeper liquidity and broader diversification major international exchanges offer, rather than being forced to choose one market exclusively at the expense of the other.
6. The JSE's broader significance despite its relative size
Despite being smaller than major global exchanges, the JSE remains genuinely significant for South African economic activity and provides meaningful local market exposure, that purely international market exposure wouldn't capture.
The underlying data itself typically comes from Stats SA (Statistics South Africa), whose release calendar is worth knowing if you want to anticipate when market-moving economic data is scheduled to land.
For South African traders specifically, this local relevance often translates into a genuine analytical advantage: living within the economy the JSE reflects gives a kind of intuitive, everyday familiarity with domestic conditions, load shedding's effect on specific sectors, consumer spending patterns, local political developments, that's harder to develop for a market on the other side of the world.
The JSE is one of Africa's largest exchanges but a fraction of the NYSE or London Stock Exchange by market capitalisation. It's dominated by mining, resources, and financial services with strong ties to the South African economy.
★ Why It Matters
Something worth tracking specifically: the JSE's correlation with broader emerging-market equity indices during global risk-off periods, South African shares sometimes move with this broader EM grouping more than with company-specific local news during these particular episodes.
✕ Common mistakes
- Evaluating the JSE in isolation rather than against comparable emerging markets. Relative positioning often matters more to capital flows than standalone size.
- Assuming JSE movement is driven primarily by local factors alone. Broader emerging-market sentiment frequently has a meaningful influence too.
- Treating the JSE's smaller size as a sign of lower quality or reliability. Size and market quality aren't necessarily linked in this way.
Key Takeaways
- The JSE is Africa's largest stock exchange by market capitalisation, though it remains considerably smaller than major global exchanges like the NYSE or NASDAQ.
- The JSE is Africa's largest stock exchange by market capitalisation, though considerably smaller than major global exchanges like the NYSE or NASDAQ.
- This reflects South Africa's position as a significant but smaller emerging market.
- The JSE's position as Africa's largest exchange.
- How JSE market capitalisation compares globally.
See also: How Does NHI Uncertainty Affect JSE Healthcare Stocks?.
Frequently asked follow-up questions
Is the JSE considered a developed or emerging market?
The JSE is generally classified within the emerging or frontier market category, though South Africa's market is considered relatively more developed than many other emerging markets.
Can international investors easily access JSE-listed shares?
Yes, various international platforms and South African brokers provide access to JSE-listed instruments for both local and international investors.
Does JSE size affect typical trading costs compared to larger exchanges?
Trading costs can vary by broker and specific instrument rather than purely reflecting exchange size, though liquidity differences can indirectly affect spread costs for some specific shares.
How many companies are listed on the JSE compared to NASDAQ?
The JSE hosts considerably fewer listed companies than NASDAQ; checking current, official listing statistics from both exchanges provides the most accurate, up-to-date comparison.
Does the JSE's relative size affect its correlation with global markets?
The JSE does show meaningful correlation with broader global market sentiment, despite its smaller relative size compared to major global exchanges.
