What this page covers
Statistics South Africa publishes GDP quarterly, and the annual figure is what the ratings agencies and the Reserve Bank build their forecasts around. The series below shows two decades of it.
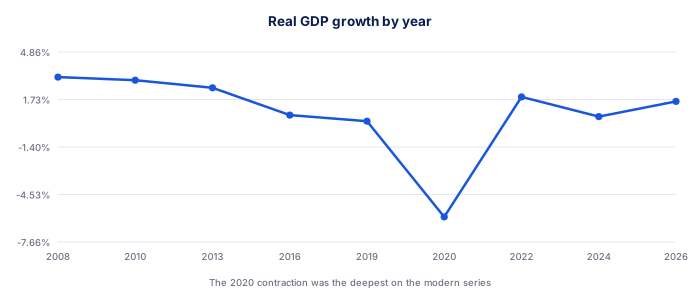
| Year | Growth | Context |
|---|---|---|
| 2026 | 1.2% | Reserve Bank forecast; rebound expected in the second half |
| 2025 | 1.3% | Power supply stabilised |
| 2024 | 0.6% | Load shedding and logistics constraints |
| 2023 | 0.7% | Severe load shedding |
| 2022 | 1.9% | Post-pandemic recovery fading |
| 2021 | 4.7% | Rebound from the 2020 contraction |
| 2020 | -6.0% | Pandemic contraction |
| 2019 | 0.3% | Stagnation |
| 2018 | 1.5% | Weak |
| 2017 | 1.2% | Recovery from technical recession |
| 2016 | 0.7% | Drought and commodity weakness |
| 2015 | 1.3% | Slowing |
| 2014 | 1.8% | Platinum strike |
| 2013 | 2.5% | Moderate |
| 2012 | 2.2% | Marikana |
| 2011 | 3.3% | Post-crisis recovery |
| 2010 | 3.0% | World Cup year |
| 2009 | -1.5% | Global financial crisis |
| 2008 | 3.2% | Slowing into the crisis |
| 2007 | 5.4% | Peak of the commodity boom |
| 2005 | 5.3% | Strong growth |
| 2003 | 2.9% | Moderate |
| 2000 | 4.2% | Strong |
| Sector | Approximate share of GDP |
|---|---|
| Finance, real estate and business services | About 22% |
| Trade, catering and accommodation | About 15% |
| Government services | About 14% |
| Manufacturing | About 13% |
| Mining and quarrying | About 8% |
| Transport and communication | About 8% |
| Agriculture | About 3% |
| Surprise | Rand | Bonds | JSE |
|---|---|---|---|
| Stronger than expected | Firmer | Yields may rise on rate expectations | Domestic shares firmer |
| Weaker than expected | Weaker | Yields may fall, or rise on fiscal worry | Domestic shares weaker |
| Two negative quarters | Sharply weaker | Fiscal risk repriced | Rand hedges outperform |

Download this data
Every table on this page as a spreadsheet, with the source and the date it was checked in the header rows.
⬇ Download CSVHow these figures work
The figures on this page come from published sources and change on a schedule rather than continuously, which is what makes them worth recording in one place. A technical recession is two consecutive quarters of negative growth. South Africa has met that definition several times in the past decade, which is why the quarterly print gets more attention than the annual one.
GDP per capita has grown far more slowly than GDP, because population growth has absorbed most of it. That gap is the reason growth figures feel better on paper than in practice.
★ A worked example
Reading the tables together is where the value is. The JSE is not the South African economy. More than half of Top 40 earnings come from outside the country, which is why the index can rise in a weak growth year.
✕ Common mistakes
- A technical recession is two consecutive quarters of negative growth. A technical recession is two consecutive quarters of negative growth. South Africa has met that definition several times in the past decade, which is why the quarterly print gets more attention than the annual one.
- GDP per capita has grown far more slowly than GDP, because population . GDP per capita has grown far more slowly than GDP, because population growth has absorbed most of it. That gap is the reason growth figures feel better on paper than in practice.
- The JSE is not the South African economy. The JSE is not the South African economy. More than half of Top 40 earnings come from outside the country, which is why the index can rise in a weak growth year.
- Taking a figure without its date. A number from a reference page is only as good as when it was last checked, which is why the date sits at the top of this one.
Notes on reading these figures
- A technical recession is two consecutive quarters of negative growth. South Africa has met that definition several times in the past decade, which is why the quarterly print gets more attention than the annual one.
- GDP per capita has grown far more slowly than GDP, because population growth has absorbed most of it. That gap is the reason growth figures feel better on paper than in practice.
- The JSE is not the South African economy. More than half of Top 40 earnings come from outside the country, which is why the index can rise in a weak growth year.
To put these figures to work, the How GDP data affects traders runs the arithmetic on your own numbers, and South African Unemployment History covers the same ground in ordinary language. South African Inflation History and Rand Exchange Rate History go into the detail this table only summarises. The JSE Indices Reference covers the part this table leaves out.
Put this table on your own site
The table below can sit on your own page and stays current without you editing anything.
- Preview the embeddable table as it will appear on your site
To put the live table on your own page, paste this where you want it to appear. It stays current without you editing anything.
<iframe src="https://www.tradeanswers.co.za/embed/ref-south-african-gdp-growth-history.html" width="100%" height="620" style="border:0" title="South African GDP Growth History"></iframe>Free to use with attribution. The link back to this page is built into the embed.
Terms used on this page
Frequently asked questions
What is a technical recession?
Two consecutive quarters of negative growth. South Africa has met that definition several times in the past decade.
Why does the JSE rise in weak growth years?
More than half of Top 40 earnings come from outside South Africa, so the index is not a proxy for the local economy.
Who publishes GDP?
Statistics South Africa, quarterly. The Reserve Bank publishes its own forecast alongside each MPC statement.
Why has GDP per capita grown so slowly?
Population growth has absorbed most of the output growth, which is why the figures feel better on paper than in practice.
Does a GDP print move the rand?
A surprise does, through what it implies for rates and for the fiscal position. The number itself is usually close to expectations.
Which sector is largest?
Finance, real estate and business services, at about 22% of output. Mining is about 8% despite its weight in the index.