i Short answer
Moving averages, the RSI, and MACD are among the most widely used technical indicators among South African retail traders.
Each measures a different aspect of price behaviour: trend direction, momentum strength, or potential reversal points.
📋 ON THIS PAGE
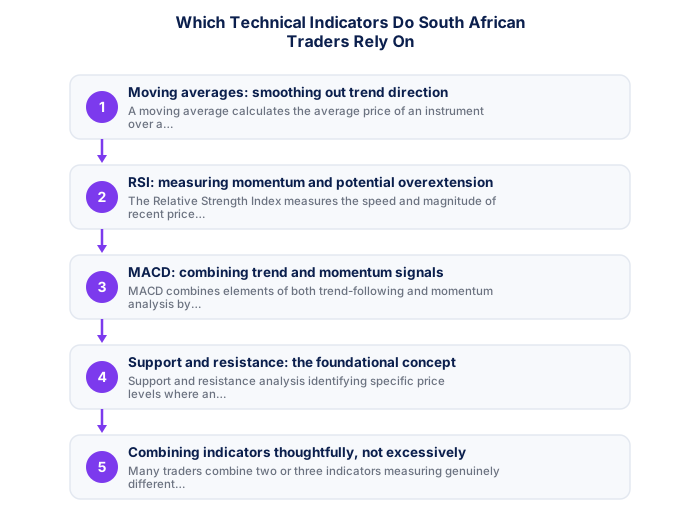
1. Moving averages: smoothing out trend direction
A moving average calculates the average price of an instrument over a specified number of recent periods (for example, the last 50 or 200 days), updating continuously as new price data comes in, and plotted as a smoothed line overlaying the actual price chart. This smoothing helps filter out short-term price noise, making the broader underlying trend direction easier to identify visually than looking at raw, unsmoothed price action alone.
Traders commonly use moving averages to identify overall trend direction (price consistently above a rising moving average suggesting an uptrend, and vice versa for downtrends), and sometimes specifically watch for crossovers between different moving average periods (for example, a shorter-period average crossing above a longer-period average) as a potential signal of a developing trend shift, though these crossover signals can also produce false signals, particularly during periods of choppy, range-bound price action without a clear sustained trend.
See also: How Does Load Shedding Affect My Trading Day?
See also: How Does SA Household Debt Affect Traders and JSE?
See also: Momentum Trading vs Trend Following
See also: What Is a Trading Strategy Walk-Forward Test?
See also: How Does SA's BRICS Membership Affect the Rand?
See also: How Do Remittances Affect the Rand and Current Account?
See also: How Do I Open a Trading Account as a South African?
See also: What Does the Term Lot Size Mean in Forex Trading?
See also: How Does Emigration Affect My South African Trading Accou
See also: How Do EFT Deposits Work for South African Trading Accoun
| Indicator | What It Measures |
|---|---|
| Moving Average | Trend direction, smoothed |
| RSI | Momentum, overbought/oversold conditions |
| MACD | Trend and momentum combined |
| Support and Resistance | Key price levels |
2. RSI: measuring momentum and potential overextension
The Relative Strength Index measures the speed and magnitude of recent price changes on a scale from 0 to 100, commonly used to identify when an instrument might be "overbought" (often considered above 70) or "oversold" (often considered below 30), suggesting price might be due for at least a temporary pause or reversal after a strong recent directional move.
It's worth understanding that RSI readings reaching these extreme thresholds don't guarantee an immediate reversal, during strong, sustained trending conditions, RSI can remain in "overbought" or "oversold" territory for extended periods while the underlying trend continues, meaning traders who mechanically trade against every extreme RSI reading without considering the broader trend context can experience repeated losses fighting against a strong, persistent trend.
- Quantifiable rules remove subjectivity
- Backtestable on historical data
- Works consistently when edge is genuine
- Clear entry/exit criteria reduce hesitation
- Past performance does not guarantee future results
- Risk of overfitting to historical data
- Market regimes change, edges decay
- Requires discipline through drawdown periods
- Price and volume patterns
- Works on any liquid instrument
- Faster to learn basics
- Ignores fundamental context
- Economic and financial data
- Better for longer timeframes
- Deeper knowledge required
- Ignores entry precision
3. MACD: combining trend and momentum signals
MACD combines elements of both trend-following and momentum analysis by calculating the difference between two moving averages of different periods, plotted alongside a signal line (itself a moving average of the MACD line) and often a histogram visualising the difference between these two lines. Traders commonly watch for MACD line crossovers relative to its signal line as potential indications of shifting momentum, alongside broader divergence analysis (where MACD movement doesn't confirm the direction of actual price movement, sometimes interpreted as an early warning sign of a potential trend weakening or reversal).
MACD's combination of trend and momentum elements makes it a relatively versatile, widely-used indicator, though like all indicators discussed here, it's calculated from historical price data and therefore inherently lags actual current price action to some degree, meaning MACD signals typically confirm a move that's already at least partially underway rather than predicting moves before they begin.
- Written entry/exit rules with zero ambiguity
- Backtested on minimum 3 years of data
- Walk-forward tested on out-of-sample data
- SA-specific events included in test period
- Maximum drawdown within personal tolerance
- 100+ live demo trades with consistent performance
4. Support and resistance: the foundational concept
Support and resistance analysis, identifying specific price levels where an instrument has historically paused, reversed, or experienced significant buying or selling pressure, is among the most foundational technical analysis concepts, often used alongside the more formally calculated indicators discussed above rather than as a replacement for them. Support refers to price levels where buying pressure has historically been strong enough to halt or reverse a decline; resistance refers to levels where selling pressure has historically capped advances.
These levels are identified through visual chart analysis of historical price action and are inherently somewhat subjective, different traders may identify slightly different specific levels on the identical chart, but widely-recognised, clearly visible support and resistance levels can gain additional significance precisely because many market participants are likely watching and acting on the same widely-recognised levels, connecting back to the self-fulfilling prophecy dynamic that underlies technical analysis broadly.
| Win rate | 1:1 RR | 1.5:1 RR | 2:1 RR |
|---|---|---|---|
| 40% | Losing | Break even | Profitable |
| 50% | Break even | Profitable | Profitable |
| 55% | Profitable | Profitable | Profitable |
| 60% | Profitable | Profitable | Profitable |
5. Combining indicators thoughtfully, not excessively
Many traders combine two or three indicators measuring genuinely different aspects of price behaviour (for example, a trend indicator like a moving average alongside a momentum indicator like RSI) specifically to seek confirmation across multiple, independent signals before acting, rather than relying on any single indicator in isolation. This combined approach can help filter out some false signals that any single indicator alone might generate.
However, stacking an excessive number of indicators, particularly several indicators that essentially measure very similar underlying information through different calculations, tends to create false confidence and analytical clutter rather than genuinely improved decision quality, since indicators measuring fundamentally the same underlying price information will naturally tend to agree or disagree together rather than providing independent confirmation.
6. Limitations common to all of these indicators
Every technical indicator discussed here is calculated from historical price data, meaning all of them are, to varying degrees, inherently lagging, confirming or describing price movement that has already at least partially occurred, rather than reliably predicting future movement before it begins. This lag is a fundamental mathematical property of indicators derived from historical price calculations, not a flaw specific to any particular indicator that a different or more sophisticated indicator could somehow fully eliminate.
Additionally, all of these indicators can and do generate false signals, particularly during periods of low liquidity, choppy range-bound price action, or around major unexpected news events that disrupt normal technical patterns entirely, no combination of indicators eliminates this fundamental uncertainty, which is precisely why disciplined risk management (appropriate position sizing, defined stop-losses) remains essential regardless of which specific indicators inform your trade entry decisions.
Moving averages, particularly the 20, 50, and 200 EMA, and the 14-period RSI are the most widely relied upon indicators among South African retail traders. MACD and Bollinger Bands are also commonly used.
★ Why It Matters
Something worth doing instead of simply adopting commonly cited indicators by default: track your own results using each indicator separately on your own specific instrument and timeframe, popularity among South African traders generally doesn't guarantee any specific indicator suits your own particular strategy and style.
✕ Common mistakes
- Stacking multiple popular indicators without checking for redundant, overlapping signals. Some indicators measure closely related things, adding complexity without real additional insight.
- Not tracking your own results separately using each indicator. This personal testing reveals genuine value better than general popularity statistics.
- Assuming indicator settings popularised by others automatically suit your own instrument and timeframe. Settings often need adjustment for your specific trading context.
Key Takeaways
- Moving averages, RSI, and MACD are among the most commonly used indicators. Learn what each measures and their genuine limitations.
- Moving averages, the RSI, and MACD are among the most widely used technical indicators among South African retail traders.
- Each measures a different aspect of price behaviour: trend direction, momentum strength, or potential reversal points.
- Moving averages: smoothing out trend direction.
- RSI: measuring momentum and potential overextension.
See also: What Is the Best Trading Strategy for a Beginner?.
Frequently asked follow-up questions
Which single indicator is the most reliable?
No single indicator is universally most reliable; effectiveness depends heavily on the specific market condition, instrument, and how rigorously the indicator is tested and applied within a broader, disciplined strategy.
Can I rely entirely on indicators without looking at price action directly?
Most experienced technical traders use indicators alongside, not instead of, direct visual price action analysis, since indicators are themselves derived from price and work best as a supplementary confirmation tool rather than a complete replacement for chart reading.
Do these indicators work the same way on all instruments?
The underlying calculations are the same, but how reliably any given indicator performs can vary by instrument, given differences in typical volatility, liquidity, and trading patterns between different markets like forex pairs, gold, or indices.
