i Short answer
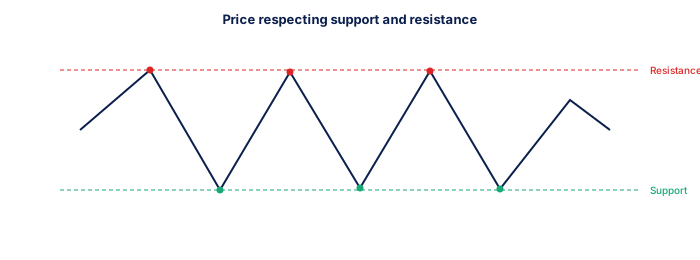
Support and resistance are price levels where buying or selling pressure has historically been strong enough to pause or reverse price movement.
You identify them by examining a chart for points where price has repeatedly stalled or reversed at a similar level. Round numbers can also act this way, see our explainer on psychological price levels. Our Pivot Point Calculator works out these reference levels automatically from the previous session's high, low, and close.
📋 ON THIS PAGE
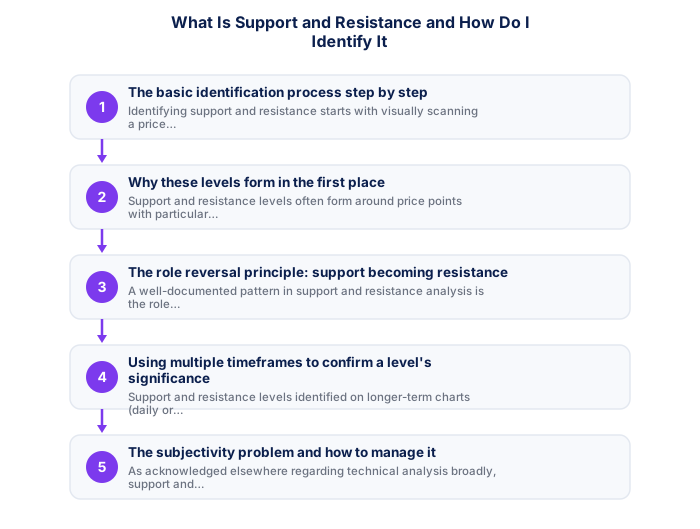
- The basic identification process step by step
- Why these levels form in the first place
- The role reversal principle: support becoming resistance
- Using multiple timeframes to confirm a level's significance
- The subjectivity problem and how to manage it
- Combining support and resistance with other analysis
- Why round numbers matter so much on USD/ZAR
1. The basic identification process step by step
Identifying support and resistance starts with visually scanning a price chart for points where price has approached a similar level multiple times without breaking through significantly, instead reversing direction at or near that level. The more times price has tested and reversed at a similar level, the more significant that level is generally considered, since this repeated testing suggests genuine, recurring market participant behaviour at that specific price point rather than a coincidental, one-time occurrence.
Many traders draw horizontal lines on their charts at these identified levels, creating a visual reference for where price has historically shown this kind of reactive behaviour, which can then inform entry, exit, and stop-loss placement decisions within a broader trading strategy.
A useful discipline when starting out is marking these levels on a clean chart before looking at where price is currently trading, rather than after. Working backward from the current price can unconsciously bias which historical touches you notice and which you overlook, while identifying levels independently of current price keeps the process more objective.
2. Why these levels form in the first place
Support and resistance levels often form around price points with particular psychological or historical significance, round numbers that traders tend to watch collectively, previous significant highs or lows that remain in market participants' memory, or levels where a large volume of historical trading activity occurred, creating a meaningful concentration of market participants with positions or interest tied to that specific level.
This connects directly to the self-fulfilling prophecy dynamic found throughout technical analysis broadly. Levels that many market participants are simultaneously watching can gain additional genuine significance specifically because of this widespread collective attention, beyond whatever original historical reason first established the level's relevance.
- FSCA-regulated broker verified at fsca.co.za
- Demo account tested for minimum 60 days
- Trading plan written: entry, exits, position sizing
- Risk per trade defined (1-2% of account)
- Backup internet connection tested for load shedding
- Tax implications understood
Round numbers deserve a specific mention here, since they're one of the more reliably observed sources of these levels across many different instruments. A level like 18.00 or 19.00 on USD/ZAR tends to attract disproportionate attention simply because round figures are easier for large numbers of market participants to remember and place orders around, independent of any deeper technical or fundamental reason for that specific price.
3. The role reversal principle: support becoming resistance
A well-documented pattern in support and resistance analysis is the role reversal principle, once a support level is genuinely broken (meaning price falls clearly through it rather than reversing), that same level often subsequently functions as resistance if price later attempts to climb back toward it, and vice versa for a broken resistance level subsequently functioning as support.
This pattern is thought to reflect a shift in market psychology at that specific level, traders who previously bought at that level as support, after watching it break down, may now sell as price approaches that same level again, having learned from the recent break that this level no longer holds the same supportive significance it once did.
This is worth watching for specifically because it offers a genuinely useful, repeatable trading concept beyond simply identifying the original level. Many traders specifically look for a retest of a broken level as a potential entry opportunity in the new direction, buying a retest of broken resistance now acting as support, for example, rather than only using support and resistance for the original level's first test.
4. Using multiple timeframes to confirm a level's significance
Support and resistance levels identified on longer-term charts (daily or weekly timeframes) are generally considered more significant and reliable than levels identified only on very short-term charts (minute-level timeframes), since longer-term levels reflect price behaviour accumulated over a longer, more meaningful period, involving a broader range of market participants and conditions.
Many traders specifically cross-reference levels across multiple timeframes, identifying a level on a longer-term chart first, then using shorter-term charts to refine precise entry timing around that broader, more significant level, combining the reliability of longer-term analysis with the precision shorter-term charts can offer for actual trade execution timing.
| Item | Detail |
|---|---|
| Regulator | FSCA, fsca.co.za |
| Exchange control | SARB, resbank.co.za |
| Tax authority | SARS, sars.gov.za |
| JSE hours | 09:00-17:00 SAST Mon-Fri |
| Best forex session | 15:00-17:00 SAST |
| CGT annual exclusion | R50,000 (individuals) |
It's worth being deliberate about which timeframe you're using for which purpose, rather than switching between them inconsistently. Using a daily chart to identify the broad level worth watching, then a much shorter timeframe purely to fine-tune the exact entry once price approaches that level, keeps the two timeframes serving distinct, complementary roles rather than creating conflicting signals.
5. The subjectivity problem and how to manage it
Support and resistance identification carries genuine subjectivity. Different traders examining the identical chart may draw slightly different specific levels, since there's no single, universally agreed mechanical formula for precisely identifying these levels the way there is for calculating a moving average.
Managing this subjectivity involves developing your own consistent, personal methodology for identification (for example, specifically requiring at least two or three historical touches at a similar level before considering it significant) and applying this consistently across your analysis, rather than redefining your criteria differently for each individual chart in ways that might unconsciously bias your analysis toward whatever conclusion you're already inclined to reach.
Writing your specific identification criteria down, rather than keeping them as a loose mental habit, makes this consistency easier to maintain and easier to review honestly later. If your trading journal shows you applying a 'two touches minimum' rule on some charts but accepting a single touch on others, that inconsistency itself is useful information worth addressing directly.
6. Combining support and resistance with other analysis
Support and resistance analysis works well combined with other technical indicators, for example, watching for RSI showing overbought or oversold conditions specifically as price approaches a previously identified resistance or support level respectively, providing additional confirmation beyond the support and resistance level alone, rather than relying on any single analytical approach in isolation.
This combination approach reflects the broader principle of combining multiple indicators thoughtfully. Support and resistance provides the specific price levels of interest, while other indicators can provide additional confirming or disconfirming signals at those specific levels, together forming a more complete analytical picture than either approach would provide alone.
Either way, letting the instrument's own volatility set the distance is sounder than picking a figure that looks tidy. volatility
Support is a price level where buying pressure has historically exceeded selling pressure. Resistance is the opposite. The more times a level has been tested and held, and the more recently, the stronger it generally is.
★ Why It Matters
Worth testing on your own charts: mark levels using a round, psychologically significant number (like 1.0900) versus a level derived purely from where price has technically reacted before. Comparing how often each type holds for your specific instrument reveals which kind of level matters more in that market.
✕ Common mistakes
- Marking levels inconsistently from different chart views or timeframes. This produces unreliable, hard-to-replicate levels.
- Treating every touch of a level as confirmation of its strength. A level that's broken cleanly afterward wasn't necessarily as significant as it seemed.
- Not backtesting how often your marked levels actually held historically. This gives concrete, personal evidence rather than relying on visual impression alone.
7. Why round numbers matter so much on USD/ZAR
On rand pairs, the most reliable levels are frequently not the ones drawn from previous highs and lows. They are whole numbers. USD/ZAR repeatedly stalls, reverses and consolidates around R16, R17 and R18, and the reason is structural rather than technical: liquidity clusters at round figures because that is where institutions place orders, where option strikes concentrate, and where commentary anchors expectations.
This has two practical consequences. Placing a stop just beyond a round number puts it exactly where resting liquidity is thickest, which is the part of the chart most likely to be swept before the move continues. And a level that has already held several times becomes more widely watched, which is self-reinforcing until it breaks decisively. Why USD/ZAR keeps testing R17 covers the mechanism, and what moves the pair covers what eventually breaks these levels.
Key Takeaways
- Support and resistance are price levels where buying or selling pressure has historically paused or reversed movement. Learn how to identify them on a chart.
- Support and resistance are price levels where buying or selling pressure has historically been strong enough to pause or reverse price movement.
- You identify them by examining a chart for points where price has repeatedly stalled or reversed at a similar level.
- The basic identification process step by step.
- Why these levels form in the first place.
Frequently asked follow-up questions
How many historical touches are needed before a level counts as genuine support or resistance?
There's no universal rule, though many traders look for at least two or three clear historical reversals at a similar level before considering it meaningfully significant.
Can support and resistance levels change over time?
Yes, levels can weaken or strengthen as market conditions evolve, and the role reversal principle discussed above means a level's function (support versus resistance) can change entirely once genuinely broken.
Is support and resistance analysis useful for all instruments?
Yes, the underlying principle applies broadly across forex, gold, indices, and other instruments, though specific levels and their significance are unique to each individual instrument's own price history.
