i Short answer
A volatility calculator computes statistical volatility measures, commonly ATR or standard deviation, for a specific instrument over a chosen recent period.
This helps calibrate position sizing and stop-loss placement to genuinely current market conditions. Our own Volatility Calculator computes standard deviation and annualised volatility from a price series you enter.
📋 ON THIS PAGE
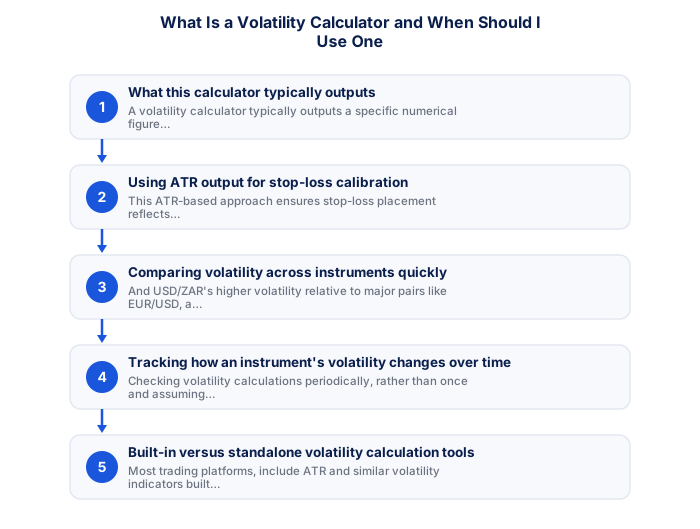
- What this calculator typically outputs
- Using ATR output for stop-loss calibration
- Comparing volatility across instruments quickly
- Tracking how an instrument's volatility changes over time
- Built-in versus standalone volatility calculation tools
- Integrating this into your broader risk management process
- What 2026 volatility actually looked like
1. What this calculator typically outputs
A volatility calculator typically outputs a specific numerical figure representing an instrument's typical recent price movement magnitude, for ATR specifically, this figure is expressed in the instrument's own price units (pips for forex, points for indices), calculated as the average true range over a chosen recent lookback period, commonly 14 periods as a standard default setting.
It's worth checking exactly which specific volatility measure your particular tool calculates, discussed elsewhere on this site regarding standard deviation and ATR specifically, since different measures can produce genuinely different figures worth understanding rather than treating all volatility outputs as interchangeable.
2. Using ATR output for stop-loss calibration
Many traders set stop-loss distance as a multiple of current ATR (for example, 1.5 or 2 times the current ATR reading) rather than using a fixed, static pip distance regardless of current market conditions. This ATR-based approach ensures stop-loss placement genuinely reflects current, real volatility, automatically adjusting wider during more volatile periods and tighter during calmer periods.
It's worth recalculating this figure regularly rather than setting a stop-loss distance once and reusing it indefinitely, an instrument's ATR shifts as market conditions change, meaning a distance appropriate during calmer conditions may prove too tight once volatility genuinely increases.
3. Comparing volatility across instruments quickly
And USD/ZAR's higher volatility relative to major pairs like EUR/USD, a volatility calculator lets you quickly, quantitatively confirm and compare these qualitative volatility differences, rather than relying solely on general reputation or qualitative description.
It's worth doing this comparison specifically before trading any instrument you're less familiar with, discussed elsewhere on this site regarding adjusting risk management for less familiar pairs, confirming an unfamiliar instrument's typical volatility before applying your usual position sizing habits protects against miscalibrated risk.
4. Tracking how an instrument's volatility changes over time
Checking volatility calculations periodically, rather than once and assuming the figure remains constant indefinitely, reveals how an instrument's typical movement can shift over time, sometimes increasing significantly around major news events or shifting broader market conditions, requiring corresponding adjustment to position sizing and stop-loss calibration if you're actively trading during these changing conditions.
It's worth checking this trend specifically around scheduled major events, discussed elsewhere on this site regarding trading around news releases, volatility often shifts meaningfully in the periods surrounding significant, known events, worth anticipating rather than being caught by surprise.
5. Built-in versus standalone volatility calculation tools
Most trading platforms, include ATR and similar volatility indicators built directly into their charting functionality, displaying the current reading directly on the chart without requiring a separate, standalone calculator tool. This built-in availability makes volatility checking a low-effort, easily-incorporated habit within your normal chart analysis routine.
It's worth checking your specific platform's built-in volatility indicators first, before assuming you need a separate, standalone calculator, most modern charting platforms include ATR and similar volatility measures directly, worth confirming what's already available before seeking an external tool.
6. Integrating this into your broader risk management process
Combining current volatility readings with the position size and profit/loss calculators discussed earlier in this category creates a complete, current-conditions-aware risk management workflow, checking current volatility first to inform stop-loss placement, then using this stop-loss distance within your position sizing calculation, and finally confirming the resulting risk-reward profile, all reflecting genuinely current market conditions rather than static, potentially outdated assumptions.
A volatility calculator, typically using ATR, helps calibrate stop-loss distances and profit targets to the instrument's actual range rather than arbitrary fixed levels, improving trade quality.
★ Why It Matters
Worth recalculating specifically before any major scheduled news event: your stop-loss distance based on the instrument's current ATR rather than a fixed pip distance you always use, volatility-adjusted stops sized for calm conditions are routinely too tight for the wider swings around high-impact releases.
✕ Common mistakes
- Using a fixed stop-loss distance regardless of current volatility. A volatility-adjusted stop better matches current market conditions.
- Not recalculating volatility before trading around major scheduled news. Volatility can shift considerably around these specific events.
- Assuming volatility readings stay stable over long periods. It can change meaningfully between calmer and more turbulent market regimes.
- Sizing positions without referencing current volatility data at all. This omission can lead to mismatched risk relative to actual market behaviour.
What 2026 volatility actually looked like
A volatility calculation is only useful if you have a sense of what normal looks like, and 2026 supplied a wide range of readings on South African assets.
The JSE All Share traded between roughly 104,093 and 129,339 over the past twelve months, a range of about 24% of the lower figure. Within that, June produced a sharp drawdown led by precious metals miners and August produced an equally sharp recovery, with gold mining shares moving 15% down and 38% up in single months.
Those are not equivalent conditions, and a position size calculated on the average volatility of the year would have been wrong in both. In a quiet month it would have been too small to matter; in June it would have been too large to survive.
This is the argument for volatility-adjusted sizing rather than fixed sizing. Measuring recent volatility, through average true range or standard deviation of returns, and scaling the position so that a typical move represents a consistent rand risk, keeps the risk stable while the market changes around it.
The rate cycle adds a scheduled source of volatility worth planning around. The Reserve Bank raised rates on 23 September 2026 and meets again on 19 November. Instruments sensitive to the rand and to local rates tend to see wider ranges around those dates, and a position sized on the preceding quiet fortnight will be oversized going into them.
| JSE All Share, 2026 | Level |
|---|---|
| 52-week low | about 104,093 |
| March record | 129,339 |
| Early August | 115,306 |
| Early September | about 116,700 |
Frequently asked questions
Which volatility measure should I use?
Average true range is the practical one for sizing a stop, because it is expressed in the instrument's own units rather than as a percentage.
Does higher volatility mean higher risk?
It means a wider range of outcomes. Whether that is risk depends on your position size, which is exactly what the measure should be driving.
How many periods should I use?
Fourteen is the common default. A shorter window reacts faster and is noisier; a longer one is steadier and slower to register a change in regime.
