i Short answer
Volatility measures how much and how quickly an instrument's price fluctuates over a given period.
It's commonly gauged through standard deviation of returns, or practically through tools like Average True Range (ATR), which our ATR Stop Loss Calculator uses directly to size a volatility-adjusted stop.
📋 ON THIS PAGE
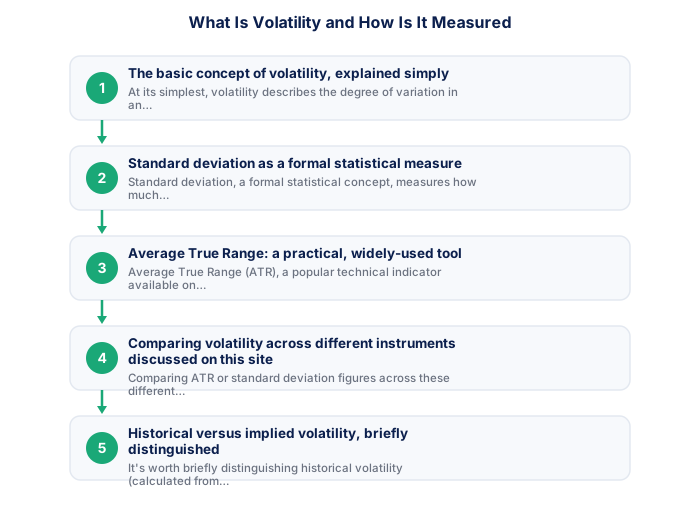
- The basic concept of volatility, explained simply
- Standard deviation as a formal statistical measure
- Average True Range: a practical, widely-used tool
- Comparing volatility across different instruments
- Historical versus implied volatility, briefly distinguished
- Using volatility measures in practical risk management
- Why the rand is more volatile than the majors
1. The basic concept of volatility, explained simply
At its simplest, volatility describes the degree of variation in an instrument's price over time. A highly volatile instrument experiences large, frequent price swings, while a low-volatility instrument moves more gradually and predictably. This concept underlies much of the risk discussion in trading, since higher volatility generally translates into both greater potential profit opportunity and greater potential loss risk for any given position size.
Understanding an instrument's typical volatility characteristics is foundational to position sizing and risk management, since appropriate stop-loss distances and position sizes should genuinely reflect an instrument's actual typical price behaviour rather than applying identical risk parameters uniformly across instruments with genuinely different volatility profiles.
See also: How Does Load Shedding Affect My Trading Day?
See also: What Is an Account Base Currency and Can I Change It?
See also: How Do Sovereign Credit Rating Reviews Affect the Rand?
See also: How Do I Evaluate Trading Podcasts and Audio Content?
See also: How Do I Read an Economic Calendar in South African Time?
See also: Am I Ready to Start Trading? A Practical Checklist
It's worth separating volatility from direction in your own thinking, since the two are easy to conflate. A highly volatile instrument isn't necessarily one moving strongly in a particular direction, it's one moving a lot in general, sometimes in a clear trend, sometimes back and forth without ever going anywhere meaningful. Both patterns count as high volatility, even though only one of them typically offers genuine directional trading opportunity.
| Feature | Historical Volatility | Implied Volatility |
|---|---|---|
| Based on | Actual past price movement | Market expectations, often from options pricing |
| Forward-looking | No | Yes |
| Common tools | Standard deviation, ATR | Options-derived indices like the VIX |
2. Standard deviation as a formal statistical measure
Standard deviation, a formal statistical concept, measures how much individual price changes typically deviate from the average price change over a given period, a higher standard deviation indicates greater typical variation and therefore higher volatility, while a lower standard deviation indicates more consistent, predictable price behaviour with less typical variation around the average.
While genuinely precise and widely used in more quantitative or academic analysis of market behaviour, standard deviation calculations require more statistical background to compute and interpret directly compared to the more practically accessible tools discussed next, which most retail traders find more immediately useful for everyday trading decisions.
- FSCA-regulated broker verified at fsca.co.za
- Demo account tested for minimum 60 days
- Trading plan written: entry, exits, position sizing
- Risk per trade defined (1-2% of account)
- Backup internet connection tested for load shedding
- Tax implications understood
For most retail traders, the practical takeaway is knowing this concept exists and what it broadly represents, rather than needing to calculate it manually. The tools discussed next give you the same essential information in a form that's considerably easier to apply directly to everyday trading decisions without requiring a statistics background.
3. Average True Range: a practical, widely-used tool
Average True Range (ATR), a popular technical indicator available on virtually all charting platforms, calculates the average size of an instrument's price range (accounting for gaps between sessions) over a specified recent period, giving a single, practical number representing typical recent price movement magnitude in the instrument's own price units (pips for forex, or relevant units for other instruments).
Many traders use ATR directly and practically to inform stop-loss placement, setting a stop-loss distance as a multiple of the current ATR reading, for example, ensures the stop-loss genuinely reflects the instrument's actual current typical volatility rather than using an arbitrary, fixed distance disconnected from real, current market behaviour.
This approach solves a genuine, common problem with fixed-pip stop-losses: a 30-pip stop might be entirely reasonable for a calm trading day but far too tight during a genuinely volatile session, getting hit by ordinary noise rather than a real reversal of your trade thesis. Basing the distance on current ATR instead means your stop-loss automatically widens or tightens to reflect what the market is actually doing right now, rather than what it happened to be doing when you first decided on a fixed pip figure.
4. Comparing volatility across different instruments
Different instruments show meaningfully different typical volatility characteristics. USD/ZAR typically shows higher volatility than major developed-market currency pairs, while silver typically shows higher volatility than gold despite both being precious metals. Comparing ATR or standard deviation figures across these different instruments gives concrete, quantified confirmation of these qualitative volatility comparisons.
This quantified comparison capability is genuinely useful for position sizing and risk management, since it gives objective, current data for calibrating stop-loss distances and position sizes appropriately for whichever instrument you're currently trading, rather than relying solely on general, qualitative volatility reputation from educational content.
| Item | Detail |
|---|---|
| Regulator | FSCA, fsca.co.za |
| Exchange control | SARB, resbank.co.za |
| Tax authority | SARS, sars.gov.za |
| JSE hours | 09:00-17:00 SAST Mon-Fri |
| Best forex session | 15:00-17:00 SAST |
| CGT annual exclusion | R50,000 (individuals) |
This is particularly worth doing before trading an instrument you're less familiar with. A trader accustomed to a lower-volatility major pair who applies the identical stop-loss and position sizing habits to a considerably more volatile instrument, without first checking how that instrument's typical range actually compares, is likely to be stopped out by entirely normal price movement far more often than their prior experience would suggest.
5. Historical versus implied volatility, briefly distinguished
It's worth briefly distinguishing historical volatility (calculated from actual past price movements) from implied volatility (a forward-looking measure derived from options pricing, reflecting the market's current expectation of future volatility). Implied volatility is a more specialised concept primarily relevant to options trading, which falls outside the core CFD and forex content this site primarily covers, though it's worth being aware this related but distinct concept exists if you encounter it in broader financial discussion.
For CFD and forex trading, historical volatility measures like standard deviation and ATR above are the more directly relevant and commonly used tools for practical trading decisions.
6. Using volatility measures in practical risk management
Practically incorporating volatility measures into your trading approach means regularly checking an instrument's current ATR or similar volatility indicator before finalising stop-loss placement and position sizing for a specific trade, rather than using fixed, static parameters that don't account for how an instrument's volatility can itself change meaningfully over time, sometimes increasing significantly around major news events or changing market conditions.
This dynamic, volatility-aware approach to risk management is a more sophisticated refinement of basic position sizing principles, helping ensure your risk management genuinely reflects current, real market conditions rather than static assumptions that may become outdated as an instrument's volatility characteristics evolve over time.
It's worth building a habit of checking current ATR specifically around scheduled high-impact events, since volatility can shift meaningfully in the lead-up to and aftermath of a major announcement. A stop-loss distance calculated from ATR data collected during a calm prior period may no longer reflect the instrument's actual behaviour once conditions change, which is exactly why this should be an ongoing check rather than a one-time calculation.
ATR, the Average True Range, is the most practical volatility measure for traders. It directly informs stop-loss distance and position sizing. Implied volatility from options markets is more forward-looking but less directly actionable.
★ Why It Matters
Worth checking for your traded instrument: its ATR value during the calmest and most volatile weeks of the past year, side by side. This range gives you a much more useful, personal sense of realistic volatility swings than a single current snapshot reading.
✕ Common mistakes
- Using a fixed stop-loss distance regardless of current measured volatility. A volatility-adjusted approach better reflects genuinely current conditions.
- Assuming volatility measures are interchangeable across different methodologies. Standard deviation and ATR, for instance, capture related but distinct aspects of price behaviour.
- Not recalculating volatility before trading around scheduled high-impact events. Conditions can shift considerably around these specific moments.
7. Why the rand is more volatile than the majors
Volatility measures are only meaningful in comparison, and the rand sits well above the majors on every one of them. USD/ZAR has covered a 52-week range of roughly R15.43 to R19.93, more than 25% of its own value, while a major like EUR/USD typically moves a fraction of that over the same period. Positions sized by habit rather than by measured range are therefore frequently too large on rand pairs.
Two structural reasons drive it. The rand is a high-beta emerging-market currency that global funds use as a liquid proxy for emerging-market risk generally, so it sells off during global stress regardless of local conditions. And because South Africa exports metals and imports oil, commodity swings feed into the currency from both directions at once. What actually moves the rand covers those drivers, including the carry unwinds that produce the sharpest moves.
Key Takeaways
- Volatility measures how much and how quickly an instrument's price fluctuates. Learn the common ways traders gauge and compare it across instruments.
- Volatility measures how much and how quickly an instrument's price fluctuates over a given period.
- It's commonly gauged through standard deviation of returns, or practically through tools like Average True Range (ATR).
- The basic concept of volatility, explained simply.
- Standard deviation as a formal statistical measure.
Frequently asked follow-up questions
Is high volatility always bad for traders?
Not inherently. Higher volatility creates both greater risk and greater potential opportunity, the key is making sure position sizing and risk management genuinely account for this elevated volatility appropriately.
Does ATR predict future price direction?
No, ATR measures typical movement magnitude regardless of direction. It doesn't indicate whether price is likely to rise or fall, only how much movement might typically be expected.
Can volatility itself change suddenly?
Yes, volatility can increase significantly around major news events or shifting market conditions, which is why checking current volatility measures regularly, rather than relying on outdated assumptions, matters for sound risk management.
