i Short answer
Drawdown measures the decline in your account's value from a previous peak to a subsequent low, typically expressed as a percentage.
Maximum drawdown reveals the realistic risk and psychological difficulty a strategy actually involves, information average return figures alone can hide. Our Drawdown Recovery Time Calculator shows exactly how much ground needs to be made up after a given decline.
📋 ON THIS PAGE
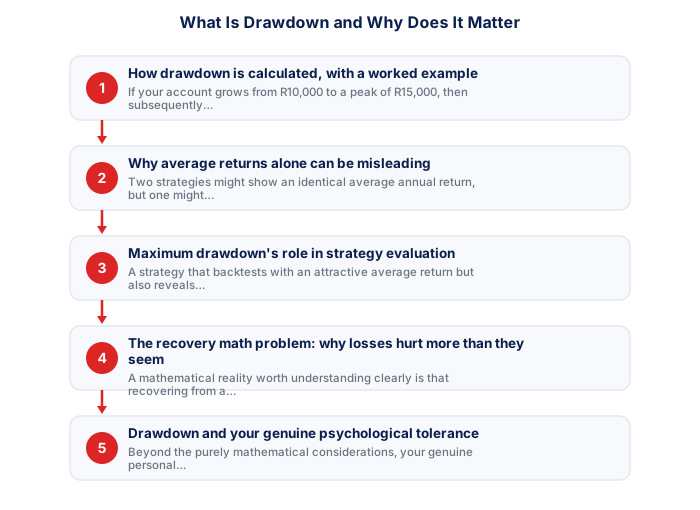
- How drawdown is calculated, with a worked example
- Why average returns alone can be genuinely misleading
- Maximum drawdown's role in strategy evaluation
- The recovery math problem: why losses hurt more than they seem
- Drawdown and your genuine psychological tolerance
- Using drawdown awareness to inform position sizing
1. How drawdown is calculated, with a worked example
If your account grows from R10,000 to a peak of R15,000, then subsequently declines to R12,000 before recovering, the drawdown during that decline is calculated as the percentage drop from the peak: (R15,000 minus R12,000) divided by R15,000, equalling a 20% drawdown. This calculation focuses specifically on peak-to-trough decline, not simply overall account performance from the very start, which is an important distinction.
| Stage | Account value |
|---|---|
| Starting value | R10,000 |
| Peak | R15,000 |
| Trough (after decline) | R12,000 |
| Drawdown from peak | 20% |
Tracking this metric throughout your trading history, most platforms or trading journal tools can calculate this automatically from your account history, gives a clear, concrete picture of the worst declines your account has actually experienced relative to its own prior peaks, rather than just an overall summary return figure.
Notice that this account is still up overall from its original R10,000 starting point, even at the R12,000 low point of this drawdown. That's precisely why drawdown and overall profitability are separate measurements: an account can be net profitable since inception while still having experienced a significant, uncomfortable drawdown along the way, and it's the drawdown figure, not the overall profit figure, that tells you how difficult that journey actually was to live through.
2. Why average returns alone can be genuinely misleading
Two strategies might show an identical average annual return, but one might achieve this steadily with modest fluctuations, while the other might achieve it through a pattern of large gains followed by severe drawdowns followed by recovery, these represent different risk profiles despite identical average return figures, and this difference matters enormously for both your psychological experience and your practical risk of running out of capital during a severe drawdown period.
This is precisely why experienced traders and professional fund evaluators look beyond simple average return figures to drawdown statistics specifically, a strategy with a smoother, lower-drawdown path to a given return is generally considered meaningfully superior to one achieving the identical return through a more volatile, higher-drawdown path, even though a purely average-return-focused comparison might suggest they're equivalent.
- D = Drawdown as decimal (e.g. 0.25 = 25%)
- 25% drawdown = needs 33% to recover
- 50% drawdown = needs 100% to recover
- 75% drawdown = needs 300% to recover
3. Maximum drawdown's role in strategy evaluation
As discussed in detail regarding backtesting elsewhere on this site, maximum drawdown is one of the most important statistics to examine when evaluating any backtested or forward-tested strategy, alongside win rate and risk-reward ratio. A strategy that backtests with an attractive average return but also reveals a severe maximum drawdown (for example, 50% or more) carries meaningfully higher practical risk than the average return figure alone would suggest, since experiencing that magnitude of decline in real trading is both financially dangerous and psychologically extremely difficult to endure without abandoning the strategy prematurely.
When evaluating any strategy, paying close, deliberate attention to its maximum historical drawdown, and honestly asking yourself whether you could genuinely tolerate experiencing a decline of that magnitude in your own real account without panicking or abandoning the strategy, is at least as important as evaluating its average return potential.
- Position size calculated before every entry
- Stop-loss defined from chart structure before entry
- Total open risk below 5% of account at any time
- No adding to losing positions under any circumstances
- Trading paused if monthly drawdown reaches 10%
- Stops never moved further away once position is open
4. The recovery math problem: why losses hurt more than they seem
A mathematical reality worth understanding clearly is that recovering from a drawdown requires a proportionally larger subsequent gain than the original loss percentage. A 20% drawdown requires a 25% subsequent gain just to return to the original peak value, while a 50% drawdown requires a 100% subsequent gain, simply breaking even, to recover fully. This asymmetry means severe drawdowns are disproportionately damaging and disproportionately difficult to recover from compared to what their percentage figure alone might intuitively suggest.
This recovery math is a significant, concrete reason why avoiding severe drawdowns in the first place, through disciplined position sizing and risk management, matters considerably more than simply maximising potential gains without equal attention to limiting potential losses.
| Drawdown | Recovery needed | At 20%/yr | At 10%/yr |
|---|---|---|---|
| 10% | 11.1% | 7 months | 14 months |
| 25% | 33.3% | 19 months | 38 months |
| 50% | 100.0% | 4+ years | 7+ years |
| 75% | 300.0% | Never at 10%/yr | Never at 10%/yr |
This is also why "protect your downside" comes up so often in risk management discussions. The mathematics of recovery means that limiting how deep a loss is allowed to go matters more, in pure compounding terms, than squeezing out slightly larger gains on winning trades. A strategy that trades this trade-off deliberately, accepting somewhat smaller average wins in exchange for meaningfully shallower typical drawdowns, is often the more durable long-term approach even when it looks less exciting on paper.
5. Drawdown and your genuine psychological tolerance
Beyond the purely mathematical considerations, your genuine personal psychological tolerance for drawdown matters significantly for sustainable trading. A strategy that's mathematically sound but produces drawdowns exceeding what you can genuinely tolerate without panicking, deviating from the strategy's rules, or abandoning it prematurely isn't actually a practically viable strategy for you specifically, regardless of how favourable its theoretical statistics appear.
This connects directly to a broader psychological truth: genuine self-awareness about your own emotional responses and limits is as important as the underlying strategy mathematics, and choosing or adjusting a strategy's risk parameters to keep drawdowns within your own tolerable range is a sound, practical approach rather than simply chasing the theoretically highest-return strategy regardless of its drawdown characteristics.
6. Using drawdown awareness to inform position sizing
Practically, understanding a strategy's likely drawdown characteristics (through backtesting and forward testing) should directly inform your position sizing decisions, if a strategy has historically shown maximum drawdowns of 30%, sizing your positions and overall risk per trade such that experiencing a similar future drawdown remains within both your financial capacity and psychological tolerance is a sound, evidence-based approach to capital allocation.
This represents a more sophisticated, genuinely risk-aware approach to position sizing than simply applying a fixed percentage risk per trade without any reference to a strategy's broader drawdown characteristics, both considerations matter together for sound, sustainable risk management.
In practice, this means periodically revisiting your risk-per-trade percentage as your trading journal accumulates more data about your actual strategy's real-world drawdown behaviour, rather than setting a figure once at the outset and never reconsidering it. A risk percentage that felt appropriate based on early, limited results may need adjusting once a larger sample of trades reveals a somewhat different drawdown pattern than initially expected.
Drawdown measures how far your account has fallen from its peak. A 25% drawdown requires a 33% gain to recover, and a 50% drawdown requires a 100% gain, making drawdown management a critical priority.
★ Why It Matters
Worth calculating specifically for your own history: your largest drawdown's duration, not just its depth, a 20% drawdown that recovered in two weeks is a very different psychological experience than the same 20% drawdown that took six months, duration matters as much as depth for assessing whether you can actually tolerate it again.
✕ Common mistakes
- Tracking only the depth of a drawdown, not its duration. A short, sharp drawdown and a long, grinding one are very different psychological experiences despite an identical depth.
- Not calculating the recovery percentage needed after a given drawdown. A 20% drawdown requires a 25% gain just to return to breakeven.
- Assuming maximum historical drawdown won't be exceeded going forward. Past maximum drawdown is informative but not a guaranteed ceiling.
- Ignoring drawdown entirely when evaluating a strategy, focusing only on average return. Drawdown reveals the real difficulty involved that average return figures can hide.
Key Takeaways
- Drawdown measures the decline from a peak account value to a subsequent low point, revealing real risk exposure beyond simple average returns.
- Drawdown measures the decline in your account's value from a previous peak to a subsequent low, typically expressed as a percentage.
- Maximum drawdown reveals the realistic risk and psychological difficulty a strategy actually involves, information average return figures alone can hide.
- How drawdown is calculated, with a worked example.
- Why average returns alone can be genuinely misleading.
Frequently asked follow-up questions
What counts as an acceptable maximum drawdown?
There's no universal figure; this depends on your personal risk tolerance and financial capacity, though many conservative traders aim to keep maximum drawdown well below 20-25% of account value.
Does drawdown only apply to losing trades?
Drawdown can occur even within an overall profitable strategy, since it measures peak-to-trough decline regardless of whether the strategy is ultimately profitable over a longer period.
Can I reduce drawdown without reducing potential returns?
Sound risk management and disciplined position sizing can often reduce drawdown severity without proportionally reducing long-term returns, though this depends significantly on the specific strategy and its underlying characteristics.
How is drawdown different from a single losing trade?
A single loss is one isolated event, while drawdown measures the cumulative decline across a whole losing sequence from peak to trough, capturing the combined effect of several consecutive or net-negative trades together.
Should I stop trading entirely if I hit my expected maximum drawdown?
This depends on whether the drawdown reflects normal statistical variance within your strategy's known range or a genuine signal of edge decay, which honest review of your trading journal can help clarify.
