i Short answer
A cost comparison calculator estimates total expected trading costs across different brokers, accounting for spread, commission, and your anticipated trading volume.
This provides a more complete comparison than checking spreads alone.
📋 ON THIS PAGE
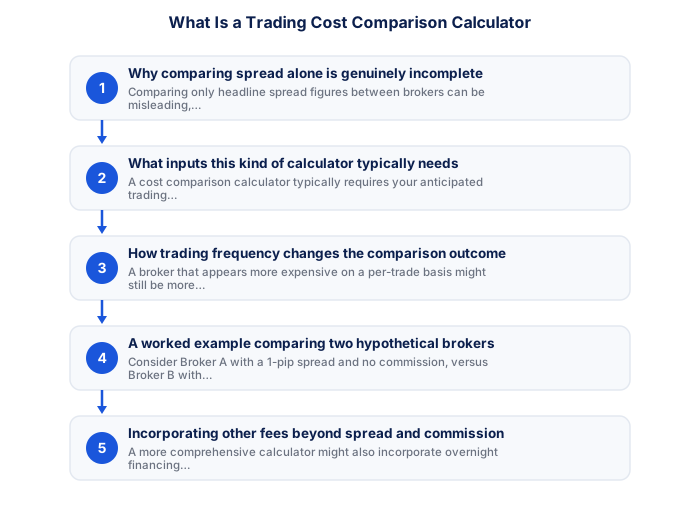
- Why comparing spread alone is genuinely incomplete
- What inputs this kind of calculator typically needs
- How trading frequency changes the comparison outcome
- A worked example comparing two hypothetical brokers
- Incorporating other fees beyond spread and commission
- Using this calculator as part of broader broker selection
- What costs actually look like in late 2026
1. Why comparing spread alone is genuinely incomplete
Comparing only headline spread figures between brokers can be misleading, since some brokers offer tighter spreads but charge separate commission, while others bundle costs differently. A genuine cost comparison requires considering these elements together rather than any single figure in isolation.
2. What inputs this kind of calculator typically needs
A cost comparison calculator typically requires your anticipated trading volume (number of trades and typical position size) alongside each broker's specific spread and commission structure for your relevant instruments, calculating the total expected cost across this anticipated activity for each broker being compared.
3. How trading frequency changes the comparison outcome
Given day trading's accumulated cost structure, a broker that appears more expensive on a per-trade basis might still be more cost-effective overall for lower-frequency trading, while the reverse can apply for high-frequency strategies like scalping. This calculator helps reveal which broker genuinely suits your specific anticipated trading pattern.
4. A worked example comparing two hypothetical brokers
Consider Broker A with a 1-pip spread and no commission, versus Broker B with a 0.5-pip spread plus a small fixed commission per trade. For low trading volume, Broker A might prove cheaper overall, while for high trading volume, Broker B's lower spread might outweigh its added commission, illustrating concretely why volume-adjusted comparison matters more than headline spread figures alone.
5. Incorporating other fees beyond spread and commission
A more comprehensive calculator might also incorporate overnight financing (rollover) charges for strategies holding positions longer-term, and any account-specific fees, providing an even more complete picture of total expected cost across your specific anticipated trading approach.
6. Using this calculator as part of broader broker selection
Cost comparison represents one important input among several. Regulation, platform quality, and execution reliability also matter significantly, making this calculator's output one useful, but not sole, factor within your broader, comprehensive broker selection process.
Many of these calculations become more robust when paired with a volatility measure like the Average True Range (ATR), which adjusts automatically to current market conditions rather than relying on a fixed assumption that may no longer fit.
A trading cost comparison calculator combines spread, commission, overnight financing, and any conversion fees into a total cost per trade, making it easier to compare brokers beyond their headline spread alone.
★ Why It Matters
Worth inputting honestly rather than optimistically: your *actual* historical trading volume from your journal, not your aspirational future volume. Cost comparisons calculated on overly optimistic volume assumptions can make a broker look more competitive than they'd actually be for your real trading pattern.
✕ Common mistakes
- Comparing costs without including financing charges alongside spread and commission. A complete comparison should include all recurring costs, not just the most visible one.
- Assuming cost comparisons remain valid indefinitely. Broker fee schedules can change, periodic rechecking matters.
- Not adjusting the comparison for your specific typical position size. Cost structures sometimes scale differently than expected with size.
What costs actually look like in late 2026
Comparing brokers on headline spread alone has always been misleading, and the September 2026 rate environment makes it more so. With the repo rate at 7.25% and the prime rate at 10.75%, the financing charged on leveraged positions held overnight has moved up with the local rate cycle.
A cost comparison needs four components rather than one. The spread is paid on entry and exit. Commission, where the broker charges it separately, is usually per lot per side. Overnight financing accrues every night a position is open, with a triple charge on Wednesdays to cover the weekend value date. Currency conversion applies whenever the instrument is priced in a currency other than the account's.
The relative weight of these changes completely with holding period. On a position held for two hours, the spread is essentially the whole cost and financing is irrelevant. On a position held for three months, financing can exceed the spread many times over, and a broker with a tight spread and expensive financing is the wrong choice.
This is why comparison tables that rank brokers by average spread produce a ranking that is only valid for very short-term traders. A swing trader holding positions for weeks should rank on financing rate first and spread second, which reverses the order in most published comparisons.
The fourth component, conversion, is the one South African traders most often miss. An account denominated in rand trading a dollar-priced instrument converts at the broker's rate on entry and exit, and that margin over mid-market is a real cost that appears in no spread table.
| Holding period | Which cost dominates |
|---|---|
| Intraday | Spread, then commission |
| A few days | Spread and financing roughly equal |
| Weeks | Financing |
| Months | Financing, by a wide margin |
Frequently asked questions
What should a cost comparison include?
Spread, commission, overnight financing and any conversion fee. Leaving out financing makes a low-spread broker look cheaper than it is for anything held beyond a day.
Does the cheapest broker always win?
No. Execution quality, slippage during news and whether the licence covers the product all matter, and none of them appear in a cost table.
How often should I recheck?
Spreads and financing rates change. Comparing once at account opening and then never again is how a cost advantage quietly disappears.
