i Short answer
Value at Risk (VaR) estimates potential portfolio loss over a specific period at a given confidence level.
This metric is more commonly used by institutional risk managers than typical retail traders, though our Value at Risk Calculator makes it easy to apply to your own positions.
📋 ON THIS PAGE
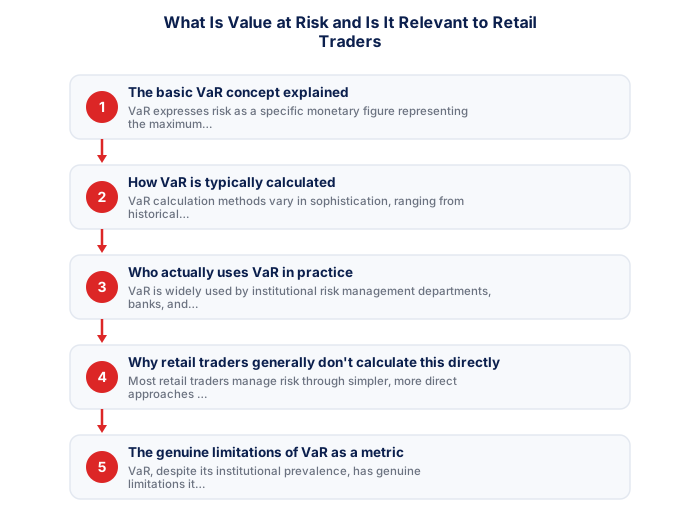
1. The basic VaR concept explained
VaR expresses risk as a specific monetary figure representing the maximum expected loss over a defined time period (commonly one day) at a stated confidence level (commonly 95% or 99%), for example, a one-day 95% VaR of R10,000 suggests there's a 95% probability that losses won't exceed R10,000 over that specific one-day period, given current portfolio composition.
| Item | Value |
|---|---|
| Confidence level | 95% |
| Time period | 1 day |
| VaR figure | R10,000 |
| Interpretation | 95% chance the loss won't exceed R10,000 over that day |
It's worth understanding this as a genuinely institutional-grade risk metric, discussed elsewhere on this site regarding risk of ruin as a more retail-relevant alternative, VaR answers a statistically sophisticated question that requires considerably more data and modelling than typical retail risk management tools.
See also: The JSE All Share Index vs the Top 40
See also: How Can SA Investors Use Forex to Hedge Rand Risk?
See also: Am I Ready to Start Trading? A Practical Checklist
See also: How Does Trading the VIX or Volatility Index Products Wor
See also: How Do I Build a Personal Trading Curriculum for Myself?
2. How VaR is typically calculated
VaR calculation methods vary in sophistication, ranging from historical simulation (examining how the current portfolio would have performed across actual historical market movements) to more complex statistical modelling approaches, all aiming to produce this single, summarised risk figure from a portfolio's current holdings and their respective volatility and correlation characteristics.
It's worth appreciating the genuine complexity these calculation methods involve, each approach requires substantial historical data, statistical modelling expertise, or computational resources well beyond what a typical retail trader would have readily available.
- D = Drawdown as decimal (e.g. 0.25 = 25%)
- 25% drawdown = needs 33% to recover
- 50% drawdown = needs 100% to recover
- 75% drawdown = needs 300% to recover
3. Who actually uses VaR in practice
VaR is widely used by institutional risk management departments, banks, and larger investment funds specifically needing to monitor and report aggregate portfolio risk across potentially complex, multi-instrument holdings, often as part of formal regulatory capital requirements or internal risk governance frameworks these larger institutions operate under.
It's worth understanding this as genuinely specialised, institutional-level risk management, banks, hedge funds, and regulatory bodies use VaR specifically because they manage portfolios and regulatory capital requirements at a scale and complexity retail trading simply doesn't involve.
- Position size calculated before every entry
- Stop-loss defined from chart structure before entry
- Total open risk below 5% of account at any time
- No adding to losing positions under any circumstances
- Trading paused if monthly drawdown reaches 10%
- Stops never moved further away once position is open
4. Why retail traders generally don't calculate this directly
Most retail traders manage risk through simpler, more direct approaches: risking a fixed percentage per trade via position sizing, and managing correlation risk through diversification awareness, rather than performing the more complex statistical modelling VaR calculation typically requires.
It's worth being genuinely comfortable with this gap rather than feeling you're missing something essential, discussed elsewhere on this site regarding simpler, more practical risk tools, retail traders have accessible alternatives that address the same underlying risk awareness need without requiring institutional-grade statistical infrastructure.
| Drawdown | Recovery needed | At 20%/yr | At 10%/yr |
|---|---|---|---|
| 10% | 11.1% | 7 months | 14 months |
| 25% | 33.3% | 19 months | 38 months |
| 50% | 100.0% | 4+ years | 7+ years |
| 75% | 300.0% | Never at 10%/yr | Never at 10%/yr |
South African traders using leveraged instruments should build their risk management framework around the principle that no single trade should be capable of significantly damaging their overall trading capital. This means calculating position sizes before every trade rather than after entry, keeping stop-losses at levels determined by chart structure rather than by the amount you are willing to lose, and reviewing your risk per trade ratio regularly as your account grows or shrinks.
5. The genuine limitations of VaR as a metric
VaR, despite its institutional prevalence, has genuine limitations, it doesn't directly describe the magnitude of loss beyond the stated confidence level (a 95% VaR says nothing specific about how bad the worst 5% of outcomes might be), and its accuracy depends heavily on the underlying statistical assumptions and historical data used, which may not always capture genuinely unprecedented market conditions.
It's worth understanding this limitation even if you never calculate VaR yourself, since it explains why even sophisticated institutional risk management didn't fully protect against certain historical market crises, VaR's statistical assumptions can break down precisely during the most extreme, consequential market conditions.
6. Simpler alternatives most retail traders actually use
For most retail traders, simpler, more directly actionable metrics, maximum drawdown, risk percentage per trade, and a risk-of-ruin calculation, give more practically useful, easily understood risk information than VaR's more complex, institutionally-oriented statistical framework.
The mathematics of recovery from drawdown is fundamental knowledge for any trader managing risk. A 10% drawdown requires an 11% gain to recover. A 25% drawdown requires a 33% gain. A 50% drawdown requires a 100% gain. A 75% drawdown requires a 300% gain to return to the starting equity level. This asymmetric relationship between losses and recovery is why controlling drawdown is mathematically more valuable than maximising returns. A trader who generates consistent 20% annual returns without a drawdown exceeding 15% will outperform a trader generating 40% returns but periodically experiencing 50% drawdowns, not just on a risk-adjusted basis but in absolute capital terms over a multi-year compounding period. Building a trading system around drawdown control as the primary objective, with returns as the secondary outcome, reflects the true mathematics of capital growth correctly.
Value at Risk estimates the maximum expected loss at a confidence level over a period. For retail traders, fixed percentage position sizing and stop-loss discipline provide more direct, actionable risk control than VaR calculations.
★ Why It Matters
Worth knowing as a limitation: VaR doesn't predict the *size* of a loss beyond its stated confidence level. A 95% VaR figure says nothing about how bad the worst 5% of outcomes could actually be, which is precisely the scenario most worth understanding for your own risk planning.
✕ Common mistakes
- Assuming VaR's relevance is identical for retail traders and institutional risk managers. It's more commonly and effectively used in institutional contexts.
- Not understanding what specifically lies outside the stated confidence interval. This is precisely the scenario most worth understanding for genuine risk planning.
- Treating a single VaR calculation as a static, permanently valid figure. It should be recalculated as portfolio composition and volatility conditions change.
Key Takeaways
- Value at Risk estimates potential portfolio loss over a specific period at a given confidence level, more commonly used institutionally than by retail traders.
- Value at Risk (VaR) estimates potential portfolio loss over a specific period at a given confidence level.
- This metric is more commonly used by institutional risk managers than typical retail traders.
- The basic VaR concept explained.
- How VaR is typically calculated.
Frequently asked follow-up questions
Can I calculate VaR myself as a retail trader?
Technically yes with sufficient statistical knowledge and tools, though the simpler metrics above generally give more practically actionable information for typical retail trading needs.
Do any retail trading platforms display VaR directly?
This is uncommon for typical retail CFD platforms, which more commonly display simpler risk metrics instead.
Is VaR more accurate than simpler risk metrics?
Not inherently more accurate. It offers a different kind of statistical summary with its own specific limitations, rather than being universally superior to simpler approaches.
