i Short answer
The All Share Index covers a considerably broader set of JSE-listed companies than the Top 40.
This provides more complete but differently-weighted overall market exposure.
📋 ON THIS PAGE
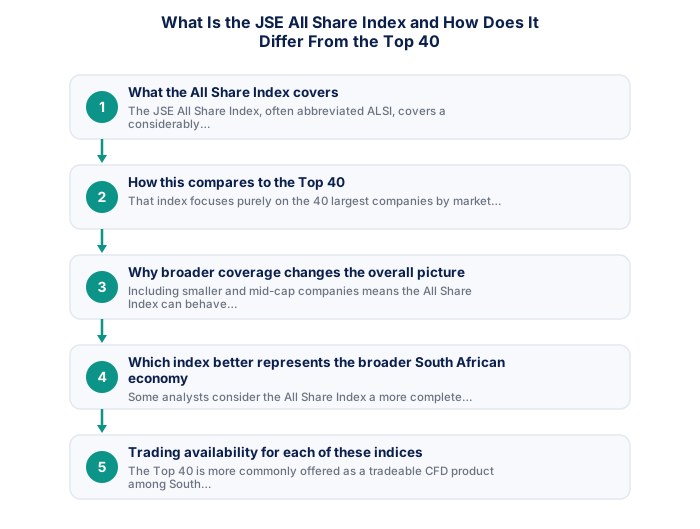
2. How this compares to the Top 40
The JSE Top 40 index (J200) tracks the 40 largest JSE-listed companies by free-float-adjusted market capitalisation. These companies represent the most internationally oriented, heavily traded segment of the South African market, large mining and resource groups, major financial institutions, consumer goods multinationals, and companies with substantial revenue from outside South Africa.
Because the Top 40 is dominated by a small number of very large companies, some of which generate the majority of their revenue from operations outside South Africa, the index is more sensitive to global commodity prices, international risk appetite, and rand/dollar dynamics than to domestic South African economic conditions. It is less a 'South African economy' index and more a large-cap multinational index that happens to be listed in Johannesburg.
- SARB economic calendar checked for the week
- Next Eskom load shedding schedule reviewed
- GNU stability news reviewed
- Stats SA data releases noted
- Credit agency review dates checked
- US/global events that move EM risk noted
The ALSI's broader coverage, by contrast, includes small and mid-cap companies whose revenue and fortunes are more directly tied to domestic South African conditions: consumer spending, domestic property and construction, local retail, regional banking, and smaller industrial operations. This makes it a somewhat different indicator of South African economic health.
3. Why broader coverage changes the overall picture
Including small and mid-cap companies means the ALSI can diverge from the Top 40 during periods when these smaller companies are moving differently from the index's largest constituents. In a domestic demand recovery, smaller consumer-facing companies might outperform significantly while large resource exporters trade flat or lower, and the ALSI would capture this divergence while the Top 40 would largely miss it.
The converse applies during global commodity cycles or risk-off episodes. Large resource companies and dual-listed multinationals in the Top 40 may move sharply in response to global factors, while smaller domestically-focused companies in the ALSI's broader constituency respond more to local conditions. Observing when the Top 40 and ALSI diverge, and understanding the sector drivers behind that divergence, provides useful analytical insight into market dynamics.
| Event | Frequency | ZAR impact | Source |
|---|---|---|---|
| SARB MPC | 6x per year | High | resbank.co.za |
| Budget Speech | Annual (February) | Very high | treasury.gov.za |
| Credit reviews | Annual each agency | Very high | Agency sites |
| Stats SA CPI | Monthly | Medium | statssa.gov.za |
| Eskom stage | As needed | Low-medium | eskomsepush.com |
- SA context provides genuine informational edge
- ZAR pairs accessible via FSCA brokers in ZAR accounts
- Rand volatility creates larger intraday ranges
- 6 SARB meetings/year create regular macro setups
- Higher geopolitical risk than G10 pairs
- Load shedding creates unique operational disruptions
- SA rand liquidity thinner than major G10 pairs
- SA-specific news requires constant local monitoring
For traders using South African equity indices as indicators of broader domestic economic sentiment, the distinction matters. The Top 40 reflects South Africa's integration into global markets; the ALSI reflects a blend of global and domestic factors with greater weight on smaller, domestically-oriented businesses.
4. Which index better represents the broader South African economy
In technical terms, the ALSI is the more complete representation of the South African listed equity market simply because it includes more of it. Whether that broader coverage makes it a better proxy for the South African economy depends on what aspect of the economy you're trying to measure.
The argument for the ALSI as a broader economic proxy is that it includes sectors and company sizes that are genuinely absent from the Top 40, particularly smaller domestically-oriented businesses whose performance correlates more directly with local consumer confidence, employment trends, and credit conditions.
The practical complication is that even the ALSI doesn't perfectly represent the South African economy, since listed companies are a subset of all economic activity. The largest components of ALSI market capitalisation are still dominated by resource companies and dual-listed multinationals, meaning neither index is a clean representation of broad-based domestic economic conditions.
5. Trading availability for each of these indices
The Top 40 is the more widely available tradeable instrument among South African and international CFD brokers. It trades as a CFD based on the underlying JSE Top 40 futures contract, offering the ability to go long or short with leverage through standard CFD mechanics. Liquidity on the Top 40 CFD is generally better than on other South African equity index products.
The ALSI as a directly tradeable CFD is less universally available. Some brokers offer it, but the product is less standardised and may carry different liquidity characteristics. Traders interested in ALSI exposure often access it through the broader JSE All Share ETF market, where several exchange-traded products track the index with a range of management fees and tracking mechanisms.
For traders whose primary interest is South African equity market exposure without a specific large-cap or broad-market preference, checking which index products your specific broker offers, and verifying their spread and liquidity on those products, is the most direct path to understanding what's practically available to you.
6. Choosing between these for your own specific purposes
Traders seeking liquid, globally-influenced South African equity exposure with straightforward CFD access will generally find the Top 40 better suited to their needs. The product is more available, better understood, and benefits from deeper liquidity connected to the JSE Top 40 futures market.
Traders or investors seeking broader South African market exposure, particularly those interested in domestic consumption trends, small and mid-cap companies, or a more complete representation of the JSE, may find the ALSI more analytically relevant, even if accessing it requires using ETFs through a stockbroking platform rather than CFD trading.
Worth checking before choosing between them: the actual overlap in constituent weighting between the two indices. Because the Top 40's largest companies are also the largest components of the ALSI, there's significant overlap between the two indices' return profiles over most time periods. The divergence occurs primarily during periods of strong small-cap or mid-cap performance, which happens periodically but not constantly.
✕ Common mistakes
- Assuming these two indices behave very differently in practice. Significant overlap in constituent weighting often means they move quite similarly.
- Treating the All Share Index as providing meaningfully broader diversification than it actually does. Concentration in large constituents persists across both indices.
- Not checking actual constituent weighting before assuming diversification benefit. The numbers, not the name, determine real diversification.
- Choosing between these indices without considering your actual exposure goals. The practical difference may be smaller than the different names suggest.
Key Takeaways
- The All Share Index covers a considerably broader set of JSE-listed companies than the Top 40, providing more complete but differently-weighted market exposure.
- The All Share Index covers a considerably broader set of JSE-listed companies than the Top 40.
- This provides more complete but differently-weighted overall market exposure.
- What the All Share Index specifically covers.
- How this compares to the Top 40.
See also: How Does NHI Uncertainty Affect JSE Healthcare Stocks?.
Frequently asked follow-up questions
Can I trade the All Share Index as a CFD through South African brokers?
Availability varies and is generally more limited than Top 40 trading. Checking your specific broker's instrument range confirms what's directly available.
Does the All Share Index include the same Top 40 companies plus more?
Generally yes, the Top 40's largest constituents are typically also included within the broader All Share Index, which then adds many additional, smaller companies beyond these.
Which index is more commonly referenced in South African financial news?
Both are commonly referenced, though the All Share Index is often cited as a general overall market performance reference in broader economic reporting.
Does the All Share Index show more or less volatility than the Top 40?
This can vary by current market conditions rather than following one fixed, universal pattern, since smaller company performance can sometimes amplify or dampen overall index movement differently than purely large-cap performance.
Is one of these indices considered more suitable for long-term investing?
Both can suit long-term approaches, though specific exposure preferences regarding company size and diversification breadth should inform this particular choice.
