i Short answer
Gross profit reflects your raw trading gains before any costs are subtracted; net profit subtracts spreads, financing charges, and fees.
Gross profit alone can meaningfully overstate how genuinely profitable your trading actually is. Our Profit Factor Calculator uses gross figures specifically to assess strategy quality, a distinct question from actual net profitability.
📋 ON THIS PAGE
1. Calculating gross profit from individual trades
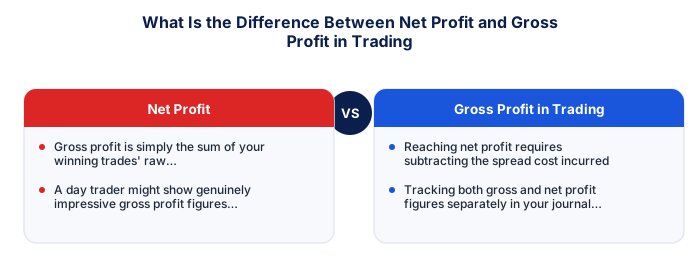
Gross profit is simply the sum of your winning trades' raw price-movement gains, calculated purely from entry and exit price differences multiplied by position size position size, without considering any of the transaction costs involved in actually executing those trades. This figure represents your trading analysis's raw effectiveness at predicting price direction, separate from the cost of implementing that analysis.
It's worth being clear that this figure alone gives an incomplete, often overly optimistic picture, discussed elsewhere on this site regarding hidden trading costs, gross profit represents your trading decisions' raw performance before the real, unavoidable costs of actually executing them.
See also: How Do I Complete the SARS ITR12 for Trading Income?
See also: Should I Use the Kelly Criterion for Position Sizing?
2. What gets subtracted to reach net profit
Reaching net profit requires subtracting the spread cost incurred on every trade, any overnight financing charges accumulated on positions held past rollover, any explicit commission charges your broker applies, and any other account-related fees that apply during the relevant period.
It's worth tracking each of these specific cost categories individually in your own records, discussed elsewhere on this site regarding hidden fees generally, understanding exactly where your costs come from helps you identify genuine opportunities to reduce them.
- FSCA-regulated broker verified at fsca.co.za
- Demo account tested for minimum 60 days
- Trading plan written: entry, exits, position sizing
- Risk per trade defined (1-2% of account)
- Backup internet connection tested for load shedding
- Tax implications understood
3. Why this gap matters more for frequent traders specifically
The gap between gross and net profit widens considerably for higher-frequency trading styles like day trading, since transaction costs accumulate proportionally with trade volume. A day trader might show genuinely impressive gross profit figures that shrink considerably once accumulated costs are properly subtracted, compared to a lower-frequency swing trader where this gap is typically more modest.
It's worth calculating your own specific gross-to-net gap based on your actual trading frequency, discussed elsewhere on this site regarding day trading capital requirements, seeing this concrete figure helps you judge whether your current trading frequency is genuinely sustainable given accumulated costs.
4. Tracking both figures in your trading journal
Tracking both gross and net profit figures separately in your journal reveals exactly how much your trading costs are affecting your bottom-line results, giving genuinely useful diagnostic information about whether cost reduction (perhaps through broker spread comparison) might meaningfully improve your overall results.
It's worth recording both figures for every trade, not just the net result, discussed elsewhere on this site regarding thorough trading journal practices, having both numbers lets you separately analyse your genuine trading decision quality and your cost efficiency.
| Item | Detail |
|---|---|
| Regulator | FSCA, fsca.co.za |
| Exchange control | SARB, resbank.co.za |
| Tax authority | SARS, sars.gov.za |
| JSE hours | 09:00-17:00 SAST Mon-Fri |
| Best forex session | 15:00-17:00 SAST |
| CGT annual exclusion | R50,000 (individuals) |
5. How this relates to genuine edge verification
The expectancy calculation that determines whether you genuinely have a statistical edge must be based on net, not gross, profit figures. A strategy showing positive gross expectancy but negative net expectancy, once costs are properly subtracted, doesn't represent a genuinely profitable strategy in practice, despite appearing successful on a gross basis alone.
It's worth always verifying your edge, discussed elsewhere on this site regarding trading edge specifically, using net rather than gross figures, a strategy that appears profitable on a gross basis can genuinely be unprofitable once real costs are properly accounted for.
6. A worked example showing the real difference
Consider a month of trading showing R5,000 in gross profit, but with accumulated spread costs of R800, financing charges of R200, and no other applicable fees, net profit for the month would be R4,000, a genuinely accurate, complete 20% reduction from the gross figure that any analysis based purely on gross profit would entirely miss, potentially leading to an overly optimistic assessment of actual trading performance.
| Item | Amount |
|---|---|
| Gross profit | R5,000 |
| Spread costs | −R800 |
| Financing charges | −R200 |
| Net profit | R4,000 |
That gap between the two figures, R1,000 in this example, represents the genuine cost of trading activity itself, separate from the market call you made.
Net profit deducts all spread, commission, and financing costs.
Gross profit only shows gains before costs. Net profit deducts spread costs, commissions, and overnight financing charges to give the only genuinely meaningful measure of actual trading performance.
★ Why It Matters
Worth calculating for your own trading: what percentage of your gross profit gets consumed by spread and financing costs over a typical month. This percentage is often considerably higher for short-term, high-frequency styles than traders initially assume when only looking at gross results.
✕ Common mistakes
- Evaluating performance using gross profit alone. This figure can meaningfully overstate how genuinely profitable trading actually is.
- Comparing your own results to others without confirming which figure, gross or net, is being discussed. This single distinction can make comparisons meaningless if mismatched.
- Ignoring financing charges when calculating actual net results. These costs accumulate alongside spread and commission, often unnoticed.
Key Takeaways
- Gross profit reflects raw trading gains before costs, while net profit subtracts spreads, financing charges, and fees to reveal your true bottom-line result.
- Gross profit reflects your raw trading gains before any costs are subtracted; net profit subtracts spreads, financing charges, and fees.
- Gross profit alone can meaningfully overstate how genuinely profitable your trading actually is.
- Calculating gross profit from individual trades.
- What gets subtracted to reach net profit.
Frequently asked follow-up questions
Do trading platforms typically display gross or net profit?
This varies by platform. Some display raw price-movement results while others incorporate costs automatically, making it worth understanding exactly what figure your platform is showing you.
Can a strategy have positive gross profit but negative net profit?
Yes, this can happen particularly with high-frequency strategies where accumulated costs exceed the raw price-movement gains.
Should I focus on minimising costs or maximising gross profit?
Both matter together. Understanding your net profit figure, accounting for both factors simultaneously, gives the most accurate picture of genuine trading performance.
