i Short answer
A risk of ruin calculator estimates the statistical probability of losing a defined portion of your account given your strategy's win rate and risk per trade.
📋 ON THIS PAGE
- What this calculator needs as input
- Why manual calculation is genuinely complex without a tool
- Interpreting the resulting probability figure correctly
- How changing your risk percentage affects this figure
- Using this tool during broader strategy evaluation
- The limitation of relying on estimated, uncertain inputs
- What risk of ruin says about a realistic South African account
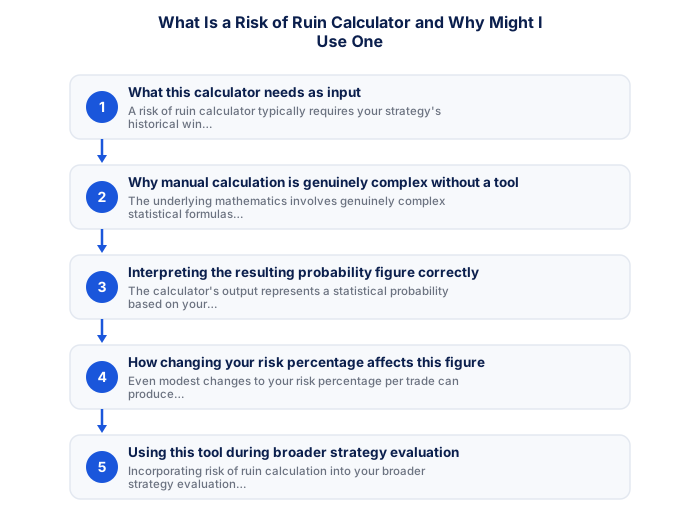
1. What this calculator needs as input
A risk of ruin calculator typically requires your strategy's historical win rate, your average risk-reward ratio, and your chosen risk percentage per trade as inputs, then applies statistical formulas to estimate the probability of experiencing a defined level of account decline given these parameters.
2. Why manual calculation is genuinely complex without a tool
The underlying mathematics involves genuinely complex statistical formulas accounting for the interaction between win rate, risk-reward ratio, and position sizing over a long sequence of trades. Performing this calculation manually without a dedicated tool is considerably more involved than simpler position sizing calculations.
3. Interpreting the resulting probability figure correctly
The calculator's output represents a statistical probability based on your specific inputs, not a certainty, a risk of ruin figure of, for example, 5% means that given your specific strategy parameters, there's roughly a 5% statistical likelihood of experiencing the defined level of account decline over a long enough sequence of trades, assuming your inputs genuinely, accurately reflect your strategy's real characteristics.
4. How changing your risk percentage affects this figure
Even modest changes to your risk percentage per trade can produce surprisingly significant changes to your calculated risk of ruin figure, illustrating concretely why conservative risk percentage guidance matters so significantly for long-term account survival.
5. Using this tool during broader strategy evaluation
Incorporating risk of ruin calculation into your broader strategy evaluation process, alongside backtesting and expectancy calculation, gives additional important risk context beyond simply knowing whether a strategy is, on average, profitable, since this calculation specifically addresses the statistical likelihood of severe, account-threatening decline.
6. The limitation of relying on estimated, uncertain inputs
It's worth recognising that this calculator's output is only as reliable as the win rate and risk-reward inputs you provide, which themselves represent estimates based on historical data requiring a sufficient sample size for genuine edge verification. A risk of ruin figure calculated from an unreliable, too-small sample carries correspondingly less genuine reliability itself.
Many of these calculations become more robust when paired with a volatility measure like the Average True Range (ATR), which adjusts automatically to current market conditions rather than relying on a fixed assumption that may no longer fit.
Risk of ruin calculations show that increasing risk per trade from 1% to 5% increases the statistical probability of account ruin dramatically. Most risk of ruin calculators take win rate and position sizing as inputs.
★ Why It Matters
Worth running with your actual numbers rather than illustrative ones: many traders are surprised by how sharply risk of ruin increases between risking 1% and 3% per trade. The relationship isn't linear, it compounds considerably faster than the percentage difference alone would suggest.
✕ Common mistakes
- Using illustrative example numbers instead of your own actual statistics. Running the calculation with your genuine win rate and risk percentage gives a far more meaningful result.
- Not recalculating after a significant change in your strategy's win rate. An outdated calculation no longer reflects your actual current risk profile.
- Treating a low risk of ruin figure as permission to increase risk per trade. The figure should inform caution, not justify pushing the boundary further.
What risk of ruin says about a realistic South African account
Risk of ruin turns three inputs into one probability: your win rate, your reward-to-risk ratio, and the percentage of the account you risk per trade. The output is the chance of losing a defined portion of the account before the edge has time to work.
The numbers are more sobering than most traders expect. A strategy with a 50% win rate and a 1:1.5 reward-to-risk ratio has a positive expectancy, but risking 5% per trade gives a meaningful probability of a 50% drawdown within a few hundred trades. Drop the risk to 1% per trade and the same strategy becomes very unlikely to hit that drawdown.
Nothing about the edge changed between those two cases. Only the position size did. This is the single most useful thing a risk of ruin calculation demonstrates: survival is determined by sizing far more than by strategy quality, and a good strategy traded too large fails anyway.
The South African context adds a second consideration. Recovering from a drawdown requires either new capital or time, and new capital is constrained by exchange control if the account is offshore. With the repo rate at 7.25% after the September increase, the opportunity cost of capital sitting in a recovering trading account is also higher than it was a year ago, because the risk-free alternative pays more.
The practical use is simple. Before adopting a risk percentage, run it through the calculation at your actual historical win rate rather than the one you hope for. If the probability of a serious drawdown is uncomfortable, the variable to change is the position size, not the expectation.
| Risk per trade | Rough probability of a 50% drawdown, 50% win rate at 1:1.5 |
|---|---|
| 1% | Very low over a few hundred trades |
| 2% | Low but no longer negligible |
| 5% | Material |
| 10% | High, even with a positive edge |
Frequently asked follow-up questions
Where can I find a risk of ruin calculator?
Various free online tools and spreadsheet templates offer this functionality. Some trading education resources also provide this as a downloadable tool.
Should I be alarmed by any non-zero risk of ruin figure?
Some non-zero risk is inherent to any leveraged trading activity. The goal is keeping this figure at an acceptably low level through disciplined risk percentage choices, not eliminating it entirely.
Does this calculation account for normal losing streaks?
Yes, the underlying statistical model specifically accounts for natural variance and losing streak possibility, which is precisely what makes this calculation genuinely useful for risk assessment.
