i Short answer
Risk of ruin estimates the statistical probability of losing your entire trading account given your risk percentage, win rate, and risk-reward ratio.
This helps you understand the genuine long-term sustainability of your chosen risk parameters, a related question worth checking is how likely a losing streak of a given length actually is at your win rate. Try our free Monte Carlo Survival Simulator to work through the numbers yourself.
📋 ON THIS PAGE
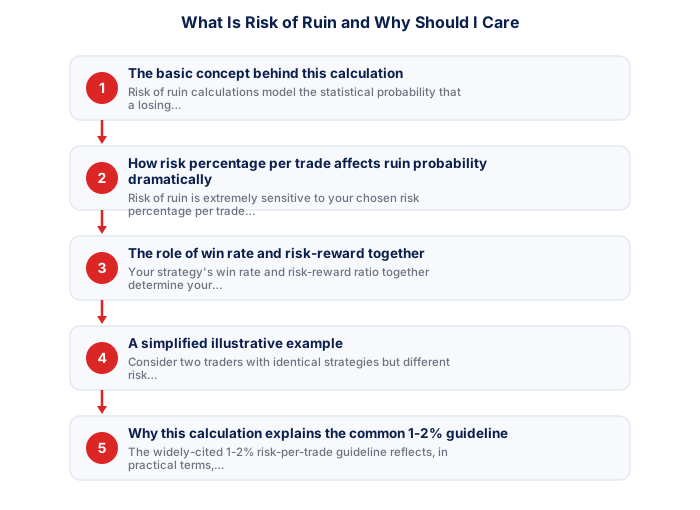
1. The basic concept behind this calculation
Risk of ruin calculations model the statistical probability that a losing streak, a normal part of statistical variance, would be severe enough to deplete your account to a level from which recovery becomes practically impossible, given your specific combination of risk percentage, win rate, and risk-reward ratio. This isn't a prediction of what will happen, but rather a statistical estimate of long-term sustainability under your chosen parameters.
It's worth sitting with the genuine seriousness of this concept, since 'ruin' here means genuinely exhausting your trading capital, not simply experiencing a difficult stretch, worth taking this specific risk seriously as a distinct, worse outcome from ordinary drawdown, discussed elsewhere on this site.
2. How risk percentage per trade affects ruin probability dramatically
Risk of ruin is extremely sensitive to your chosen risk percentage per trade. Even seemingly modest increases in this percentage can dramatically increase ruin probability, since larger risk percentages mean fewer consecutive losses are needed to produce account-depleting damage, and the recovery math behind drawdown becomes correspondingly harsher.
See also: Should I Use the Kelly Criterion for Position Sizing?
It's worth appreciating how non-linear this relationship genuinely is, doubling your risk percentage per trade doesn't simply double your risk of ruin, it typically increases it far more dramatically, worth understanding this disproportionate effect rather than assuming risk scales simply and predictably.
- D = Drawdown as decimal (e.g. 0.25 = 25%)
- 25% drawdown = needs 33% to recover
- 50% drawdown = needs 100% to recover
- 75% drawdown = needs 300% to recover
3. The role of win rate and risk-reward together
Your strategy's win rate and risk-reward ratio together determine your underlying statistical edge, which directly affects ruin probability. A strategy with weaker genuine edge requires correspondingly more conservative risk percentage to maintain acceptably low ruin probability, while a strategy with stronger, well-verified edge can sustain somewhat higher risk percentages while maintaining similar ruin probability levels.
It's worth calculating your own strategy's specific risk of ruin using your actual, verified win rate and risk-reward figures, discussed elsewhere on this site regarding these individual metrics, rather than relying on generic assumptions about how they combine.
- Position size calculated before every entry
- Stop-loss defined from chart structure before entry
- Total open risk below 5% of account at any time
- No adding to losing positions under any circumstances
- Trading paused if monthly drawdown reaches 10%
- Stops never moved further away once position is open
4. A simplified illustrative example
Consider two traders with identical strategies but different risk percentages: a trader risking 1% per trade who experiences a 10-trade losing streak loses roughly 10% of their account (accounting for compounding effects), while a trader risking 5% per trade experiencing the same losing streak loses a considerably larger proportion, given how risk percentage compounds across consecutive losses. This illustrates concretely why risk percentage choice matters so significantly for long-term account survival.
It's worth running this same calculation with your own strategy's actual figures, seeing your own genuine, personal risk of ruin percentage tends to be considerably more motivating for maintaining disciplined risk management than an abstract, illustrative example alone.
| Drawdown | Recovery needed | At 20%/yr | At 10%/yr |
|---|---|---|---|
| 10% | 11.1% | 7 months | 14 months |
| 25% | 33.3% | 19 months | 38 months |
| 50% | 100.0% | 4+ years | 7+ years |
| 75% | 300.0% | Never at 10%/yr | Never at 10%/yr |
5. Why this calculation explains the common 1-2% guideline
The widely-cited 1-2% risk-per-trade guideline reflects, in practical terms, a risk of ruin calculation suggesting this range keeps ruin probability acceptably low for most reasonably-edged strategies, even accounting for the normal losing streaks that any strategy will periodically experience regardless of its underlying genuine edge.
It's worth appreciating this connection specifically, since it transforms the commonly cited 1-2% guideline from an arbitrary rule of thumb into a mathematically grounded recommendation, worth understanding the genuine reasoning behind advice you'll encounter repeatedly throughout trading education content.
6. Practical takeaways for your own risk settings
Understanding risk of ruin conceptually, even without performing the precise underlying calculation yourself, reinforces why disciplined adherence to conservative risk percentage guidelines matters so significantly for long-term trading sustainability. The mathematical relationship between risk percentage and ruin probability is sufficiently dramatic that this isn't simply a cautious suggestion, but a genuinely important statistical consideration for anyone trading with real capital over an extended period.
For traders who want to go beyond simple fixed-percentage risk, the Kelly Criterion offers a more mathematically grounded way to size positions based on your actual win rate and reward ratio, though most retail traders find a conservative fraction of the full Kelly figure far more practical than the raw calculation.
The mathematics of recovery from drawdown is fundamental knowledge for any trader managing risk. A 10% drawdown requires an 11% gain to recover. A 25% drawdown requires a 33% gain. A 50% drawdown requires a 100% gain. A 75% drawdown requires a 300% gain to return to the starting equity level. This asymmetric relationship between losses and recovery is why controlling drawdown is mathematically more valuable than maximising returns. A trader who generates consistent 20% annual returns without a drawdown exceeding 15% will outperform a trader generating 40% returns but periodically experiencing 50% drawdowns, not just on a risk-adjusted basis but in absolute capital terms over a multi-year compounding period. Building a trading system around drawdown control as the primary objective, with returns as the secondary outcome, reflects the true mathematics of capital growth correctly.
Risk of ruin shows mathematically why position sizing matters as much as any trading edge. Even a strategy with a genuine edge eventually fails if individual trades risk too large a percentage of the account.
★ Why It Matters
Worth running this calculation with your own actual numbers rather than a hypothetical example: many traders discover their real risk of ruin is uncomfortably higher than they assumed, simply because they'd never actually run the calculation with their genuine win rate and risk percentage before.
✕ Common mistakes
- Using illustrative numbers instead of your own actual win rate and risk percentage. Running the calculation with genuine personal statistics gives a far more meaningful result.
- Assuming the relationship between risk percentage and ruin probability is linear. It compounds considerably faster than the percentage difference alone suggests.
- Not recalculating after a meaningful change in your strategy's statistics. An outdated calculation no longer reflects your current actual risk.
- Treating a low risk-of-ruin figure as licence to increase risk per trade. The figure should inform caution, not justify pushing the boundary further.
Key Takeaways
- Risk of ruin estimates the statistical probability of losing your entire trading account given your specific risk percentage, win rate, and risk-reward ratio.
- Risk of ruin estimates the statistical probability of losing your entire trading account given your risk percentage, win rate, and risk-reward ratio.
- This helps you understand the genuine long-term sustainability of your chosen risk parameters.
- The basic concept behind this calculation.
- How risk percentage per trade affects ruin probability dramatically.
Frequently asked follow-up questions
Can I calculate my own specific risk of ruin precisely?
Various online calculators and formulas exist for this purpose, though they require reasonably accurate win rate and risk-reward inputs from a meaningful sample of your own trading history.
Does risk of ruin assume my strategy has zero edge?
No, calculations incorporate your strategy's actual win rate and risk-reward ratio; a strategy with no genuine edge would show very high ruin probability even at conservative risk percentages.
Is risk of ruin the same as drawdown?
They're related but distinct. Drawdown measures actual historical decline, while risk of ruin estimates the forward-looking statistical probability of complete account depletion.
What risk-of-ruin percentage is generally considered acceptably low?
Many risk-conscious traders aim to keep this calculated probability below a small single-digit percentage, though the genuinely appropriate threshold depends on your own personal risk tolerance and financial circumstances.
Does increasing my win rate or improving my risk-reward ratio reduce risk of ruin more?
Both genuinely help, though the relationship is mathematical rather than simply additive; running the actual calculation with different input scenarios reveals which specific improvement matters more for your own particular strategy's numbers.
