i Short answer
A trading edge is a demonstrable, statistical tendency for your strategy to produce profitable outcomes over a large sample of trades.
Knowing whether you have one requires rigorous backtesting and forward testing, not assuming based on a few recent successful trades.
📋 ON THIS PAGE
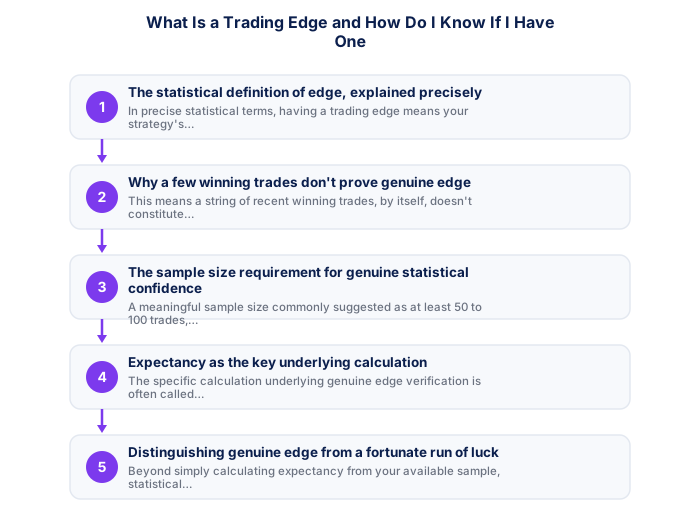
- The statistical definition of edge, explained precisely
- Why a few winning trades don't prove genuine edge
- The sample size requirement for genuine statistical confidence
- Expectancy as the key underlying calculation
- Distinguishing genuine edge from a fortunate run of luck
- Maintaining an edge over time as conditions evolve
1. The statistical definition of edge, explained precisely
In precise statistical terms, having a trading edge means your strategy's expected value per trade, the average outcome you'd anticipate across a large number of trades, accounting for both win rate and the size of typical wins versus typical losses (risk-reward ratio), is genuinely positive, after accounting for realistic transaction costs like spreads and financing charges.
This is a precise, calculable concept rather than a vague feeling of confidence or a few recent successful trades. Genuine edge can, in principle, be calculated mathematically from a sufficiently large sample of your strategy's actual historical or forward-tested results, which is exactly why rigorous testing matters so significantly for genuinely answering this question.
It's worth internalising that 'positive after costs' clause specifically, since it's where many otherwise plausible-looking strategies actually fail. A strategy that looks marginally profitable based on raw price movement alone can quietly become a losing strategy once realistic spread and financing costs are properly subtracted from every single trade in the calculation, particularly for higher-frequency approaches where these costs accumulate fastest.
2. Why a few winning trades don't prove genuine edge
Even a strategy with genuinely no real edge, essentially random in its outcomes, will periodically produce winning streaks purely by chance, in the same way a fair coin will occasionally produce several consecutive heads. This means a string of recent winning trades, by itself, doesn't constitute reliable statistical evidence of genuine edge, any more than a string of losses necessarily disproves it.
This is a genuinely important, if sometimes uncomfortable, realisation for traders who've experienced early success and want to attribute it confidently to skill and genuine edge. Without a larger sample size and rigorous testing, this attribution remains genuinely uncertain, regardless of how good recent results might feel.
- FSCA-regulated broker verified at fsca.co.za
- Demo account tested for minimum 60 days
- Trading plan written: entry, exits, position sizing
- Risk per trade defined (1-2% of account)
- Backup internet connection tested for load shedding
- Tax implications understood
A useful thought experiment: imagine ten different traders, each applying a genuinely random, no-edge approach to entries. Purely by chance, a few of them will experience an early run of wins that feels, subjectively, exactly like discovering a real edge. Nothing about how that early success feels distinguishes it from genuine skill, which is precisely why the feeling of having found an edge is not, by itself, evidence that one actually exists.
3. The sample size requirement for genuine statistical confidence
In backtesting, a meaningful sample size, commonly suggested as at least 50 to 100 trades, ideally more, spanning varied market conditions, is necessary before you can draw genuinely reliable statistical conclusions about whether your strategy demonstrates real edge, distinguishing this from the normal variance that smaller samples are particularly susceptible to.
This sample size requirement applies whether you're evaluating a backtested historical strategy or your own actual forward, live trading results. The same statistical principle holds regardless of whether you're looking backward at historical data or forward at your own accumulating real trading record.
It helps to think of this requirement less as an arbitrary rule and more as a direct consequence of how statistical noise behaves: the smaller the sample, the more a handful of lucky or unlucky trades can distort the overall picture, while a larger sample allows genuine, underlying edge, or the lack of it, to become visible above that noise.
4. Expectancy as the key underlying calculation
The specific calculation underlying genuine edge verification is often called expectancy, calculated as (win rate multiplied by average win size) minus (loss rate multiplied by average loss size), expressed as an expected value per trade. A positive expectancy figure, calculated from a sufficiently large sample, provides genuine, calculable evidence of edge, while a negative or merely zero expectancy figure indicates the strategy, as currently constructed and tested, doesn't demonstrate this genuine statistical advantage.
Calculating this figure explicitly from your own trading journal data, rather than relying on a vague subjective sense of whether your strategy "feels" profitable, gives the kind of concrete, objective evidence that genuine edge verification actually requires.
| Item | Detail |
|---|---|
| Regulator | FSCA, fsca.co.za |
| Exchange control | SARB, resbank.co.za |
| Tax authority | SARS, sars.gov.za |
| JSE hours | 09:00-17:00 SAST Mon-Fri |
| Best forex session | 15:00-17:00 SAST |
| CGT annual exclusion | R50,000 (individuals) |
It's worth recalculating this figure periodically rather than treating a single calculation as a final verdict. As your trading journal accumulates more entries, your expectancy estimate becomes progressively more statistically reliable, and revisiting the number as your sample grows is a natural, ongoing part of genuinely verifying edge rather than a one-time exercise.
5. Distinguishing genuine edge from a fortunate run of luck
Beyond simply calculating expectancy from your available sample, statistical techniques exist for assessing how confident you can genuinely be that a positive expectancy figure reflects real edge rather than a fortunate run within an actually edge-less or even negative-expectancy strategy. These techniques become more reliable as your sample size grows, reinforcing why patience in accumulating sufficient trading history before drawing strong conclusions matters considerably for this kind of rigorous self-assessment.
For most retail traders without deep statistical training, the practical takeaway is simpler: be appropriately humble and cautious about claiming genuine edge based on smaller samples, and continue accumulating evidence through continued disciplined, consistent strategy application and journaling before placing excessive confidence in any specific conclusion about your strategy's genuine effectiveness.
6. Maintaining an edge over time as conditions evolve
Even a strategy that has genuinely demonstrated edge through rigorous testing isn't guaranteed to maintain that edge indefinitely, since market conditions can evolve in ways that erode a previously effective strategy's underlying logic over time. Periodically re-evaluating your strategy's ongoing expectancy, using the same rigorous calculation discussed above applied to more recent trading data, helps detect this kind of genuine erosion before it significantly damages your overall results.
This ongoing verification process, rather than assuming an edge demonstrated once remains permanently valid without further checking, reflects the same kind of disciplined, evidence-based approach that matters for sustained trading success over time.
Whatever you settle on, a stop derived from observed volatility holds up better than one chosen for neatness. volatility
This kind of erosion often happens gradually enough that it's easy to miss without deliberately checking for it. A strategy that quietly stops working doesn't usually announce itself with a single dramatic loss, it more commonly shows up as a slow drift in expectancy over dozens of trades, which is exactly why periodic, scheduled review matters more than waiting for results to feel obviously wrong before investigating.
A genuine trading edge shows positive expectancy across a large sample of trades, not just a lucky run. Verifying it requires backtesting and forward testing across enough trades for statistical significance.
★ Why It Matters
Worth calculating: your strategy's statistical significance given your actual sample size. A positive expectancy over 20 trades carries far less statistical confidence than the same expectancy over 200, traders sometimes declare an edge confirmed well before the sample size actually supports that conclusion.
✕ Common mistakes
- Declaring an edge confirmed based on a small sample of trades. Statistical confidence increases meaningfully with sample size, 20 trades isn't usually enough.
- Assuming early profitability proves a genuine, repeatable edge exists. Favourable conditions can produce early profit independent of genuine edge.
- Not separating skill-driven results from simple market luck. This distinction requires a properly sized, rigorous sample to assess.
- Treating a single strong backtest as sufficient confirmation. Forward testing on new data provides a more reliable check.
Key Takeaways
- A trading edge is a demonstrable, statistical tendency for your strategy to profit over a large sample of trades. Learn how to genuinely verify you have one.
- A trading edge is a demonstrable, statistical tendency for your strategy to produce profitable outcomes over a large sample of trades.
- Knowing whether you have one requires rigorous backtesting and forward testing, not assuming based on a few recent successful trades.
- The statistical definition of edge, explained precisely.
- Why a few winning trades don't prove genuine edge.
Frequently asked follow-up questions
Can I have edge in some market conditions but not others?
Yes, many strategies show edge specifically in certain conditions (trending versus range-bound markets, for example) and little or no edge in others, making condition-specific evaluation genuinely useful alongside overall expectancy calculation.
Is a higher win rate always better for demonstrating edge?
Not necessarily in isolation. Expectancy depends on both win rate and the relative size of wins versus losses together, not win rate alone.
How often should I recalculate my strategy's expectancy?
Periodic recalculation, perhaps after each meaningful block of additional trades or on a regular review schedule, helps detect any genuine erosion in your strategy's edge over time.
