i Short answer
An expectancy calculator combines win rate and risk-reward ratio into a single figure representing the average expected profit or loss per trade.
This differs from win rate alone, which says nothing about the relative size of wins versus losses.
📋 ON THIS PAGE
- The expectancy formula explained simply
- Why this combines what win rate alone misses
- A worked example using this calculator
- Interpreting a positive versus negative result
- Using this calculator during strategy development
- The sample size caveat that still applies
- Why expectancy matters more in a higher-rate environment
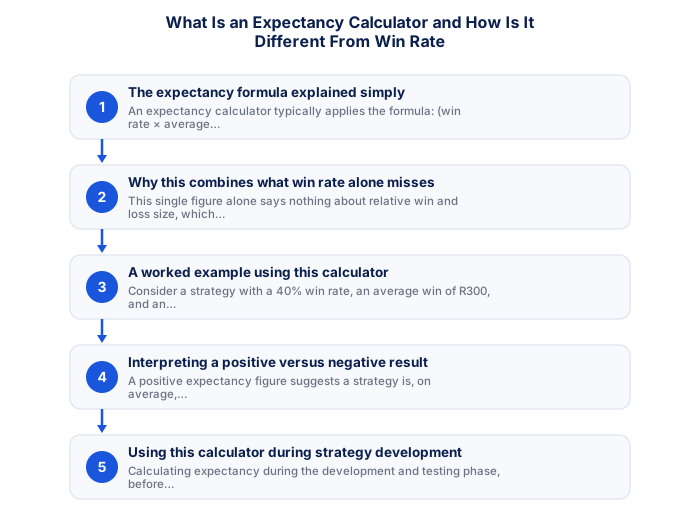
1. The expectancy formula explained simply
An expectancy calculator typically applies the formula: (win rate × average win size) minus (loss rate × average loss size), producing a single figure representing the average amount you'd expect to gain or lose per trade over a large number of repetitions, given these specific historical statistics.
It helps to think of this formula as answering a slightly different question than win rate alone: not "how often am I right," but "what does the average trade actually deliver, once wins and losses are weighted by how often each happens and how large each typically is." That second question is the one that actually determines whether a strategy grows an account over time.
2. Why this combines what win rate alone misses
Win rate alone says nothing about relative win and loss size, which is precisely why expectancy specifically combines both win rate and the actual size of wins and losses together, addressing the exact limitation that evaluating win rate in isolation would otherwise leave unaddressed.
This is precisely why two strategies with identical win rates can have completely different expectancy figures, and therefore completely different real-world outcomes, once the actual size of their typical wins and losses is factored in. Win rate by itself simply cannot distinguish between these two very different strategies.
3. A worked example using this calculator
Consider a strategy with a 40% win rate, an average win of R300, and an average loss of R150. Expectancy would be (0.40 × R300) minus (0.60 × R150), equalling R120 minus R90, producing a positive expectancy of R30 per trade, despite losing more often than winning, this strategy is genuinely profitable on average, illustrating concretely why expectancy matters more than win rate alone.
| Variable | Value |
|---|---|
| Win rate | 40% |
| Average win | R300 |
| Average loss | R150 |
| Calculation | (0.40 × R300) − (0.60 × R150) |
| Expectancy per trade | R30 |
Flip the numbers slightly and the conclusion can reverse entirely: the same 40% win rate with an average win of R150 and an average loss of R150 produces an expectancy of (0.40 × R150) minus (0.60 × R150), or R60 minus R90, a negative R30 per trade. Identical win rate, opposite outcome, purely because the relationship between win size and loss size changed.
4. Interpreting a positive versus negative result
A positive expectancy figure suggests a strategy is, on average, statistically profitable per trade over a sufficiently large sample, while a negative figure suggests the opposite, regardless of how the underlying win rate alone might appear, this single combined figure provides considerably more genuinely useful information than win rate or risk-reward ratio considered separately.
A small positive expectancy figure is still meaningful, even if it looks unimpressive in isolation. Because expectancy represents an average per trade, it compounds across a large number of trades; a modest positive figure sustained consistently across hundreds of trades can produce substantial account growth over time, which is part of why consistency in applying a positive-expectancy strategy matters more than any single trade's outcome.
5. Using this calculator during strategy development
Calculating expectancy during the backtesting and testing phase, before committing significant live capital, helps confirm whether a strategy genuinely has positive expected value, providing an important quantitative checkpoint beyond simply observing whether recent results felt subjectively favourable.
It's worth recalculating expectancy periodically as your live trading results accumulate, rather than relying solely on the backtested figure indefinitely. Real-world execution, including slippage, emotional deviations from the strategy's rules, and genuine market changes over time, can cause live expectancy to drift from what backtesting originally suggested, and catching that drift early is exactly what ongoing recalculation is for.
6. The sample size caveat that still applies
An expectancy figure calculated from too small a sample remains subject to the same statistical unreliability that affects any genuine edge verification. This calculator's output is only as trustworthy as the underlying win rate and average win/loss figures feeding into it, which themselves require a sufficiently large, representative sample to be meaningful.
Many of these calculations become more robust when paired with a volatility measure like the Average True Range (ATR), which adjusts automatically to current market conditions rather than relying on a fixed assumption that may no longer fit.
Win rate tells you how often you win, but not how much. Expectancy combines win rate with average winner and loser sizes into a single number that shows whether your strategy has a genuine long-term edge.
★ Why It Matters
Worth recalculating after every 20-30 trades rather than once and forgetting about it: your expectancy figure shifts as your actual results accumulate. A strategy's true expectancy only becomes statistically meaningful after a reasonably large sample, not after the first handful of trades.
✕ Common mistakes
- Relying on win rate alone without calculating overall expectancy. Win rate says nothing about the relative size of wins versus losses.
- Calculating expectancy once and treating it as permanently fixed. Recalculating after every 20-30 trades keeps the figure genuinely current.
- Ignoring expectancy when comparing two different strategies. This combined figure offers a fairer comparison than win rate or risk-reward alone.
Why expectancy matters more in a higher-rate environment
Expectancy combines win rate and average win or loss into a single figure: the average rand result per trade. Win rate alone cannot do this, which is why a strategy winning 70% of the time can still lose money.
The calculation has a hurdle that has moved this year. With the repo rate at 7.25% after the September 2026 increase, cash held in an interest-bearing account earns meaningfully more than it did. A trading strategy with a small positive expectancy is now competing against a higher risk-free alternative, and the comparison is no longer as favourable as it was when rates were lower.
That changes the threshold for whether a strategy is worth trading at all. An expectancy that produces a few percent a year, on capital exposed to drawdown and requiring active management, is worse than an instrument paying a comparable rate with none of those characteristics.
The other input that has changed is cost. Overnight financing on leveraged positions rises with local rates, and financing is subtracted from expectancy directly. A strategy measured on gross results before the rate cycle turned may have a materially lower net expectancy today without anything about the entries or exits changing.
The practical use is to recalculate expectancy net of current costs rather than relying on a figure measured months ago, and to compare the result against what the capital could earn without being at risk.
| Strategy | Expectancy per trade |
|---|---|
| 60% win rate, 1:1 | 0.20R, positive |
| 40% win rate, 1:2 | 0.20R, positive |
| 70% win rate, 1:0.3 | minus 0.09R, negative |
| 50% win rate, 1:1 after costs | Often negative |
See also: What Is a Heat Map Tool and How Do Traders Use It?.
Frequently asked follow-up questions
Is expectancy the same as the risk of ruin calculation?
No, these are related but distinct. Expectancy measures average expected profitability per trade, while risk of ruin estimates the probability of severe account decline given these and other parameters.
Can a strategy with negative expectancy ever still be used?
This isn't generally advisable; a strategy with confirmed, sufficiently-sampled negative expectancy is, by definition, expected to lose money on average over time.
Where can I find a free expectancy calculator?
Many trading education resources and spreadsheet templates offer this functionality, often built into broader journal and analytics tools.
