i Short answer
Cloud-based charting tools work independently of your specific broker, offering consistent cross-device access.
They sometimes offer more advanced analytical features than the built-in charting many platforms provide directly.
📋 ON THIS PAGE
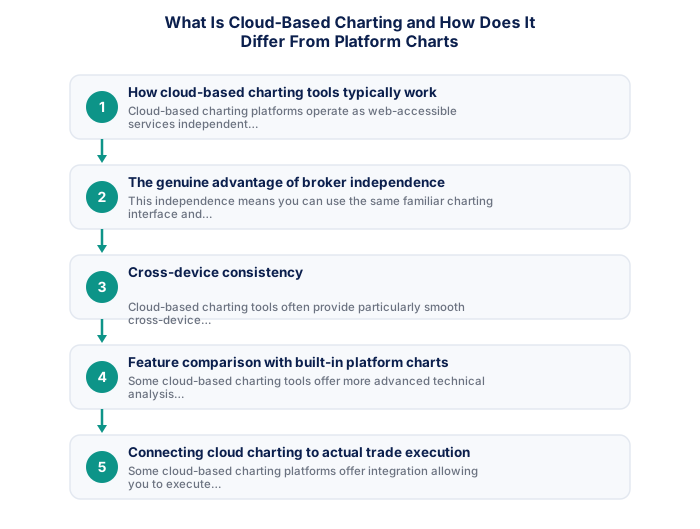
1. How cloud-based charting tools typically work
Cloud-based charting platforms operate as web-accessible services independent of any specific broker, pulling in price data from various sources and providing charting and technical analysis functionality accessible through any web browser or dedicated app rather than being tied to a single broker's specific platform.
It's worth appreciating what this architecture genuinely enables, since your charts and analysis live independently of any specific broker's platform, you retain access to your customised setup and saved analysis regardless of whether you switch brokers, discussed elsewhere on this site, or use multiple brokers simultaneously.
See also: A Trading VPS vs a Dedicated Laptop
See also: Can I Use a Tablet as My Primary Trading Device?
See also: How Do Proprietary Trading Firms Work for South Africans?
2. The genuine advantage of broker independence
This independence means you can use the same familiar charting interface and saved analysis setups regardless of which specific broker you're actually trading through, providing consistency even if you switch brokers or maintain accounts with several different providers.
It's worth considering this advantage specifically if you anticipate ever switching brokers or using multiple providers, discussed elsewhere on this site regarding broker switching, a cloud-based setup means your analytical environment remains consistent even as your underlying broker relationship changes.
- Quantifiable rules remove subjectivity
- Backtestable on historical data
- Works consistently when edge is genuine
- Clear entry/exit criteria reduce hesitation
- Past performance does not guarantee future results
- Risk of overfitting to historical data
- Market regimes change, edges decay
- Requires discipline through drawdown periods
- Price and volume patterns
- Works on any liquid instrument
- Faster to learn basics
- Ignores fundamental context
- Economic and financial data
- Better for longer timeframes
- Deeper knowledge required
- Ignores entry precision
3. Cross-device consistency
Cloud-based charting tools often provide particularly smooth cross-device consistency, since your analysis and saved chart setups exist independently of any specific device or broker platform, accessible consistently whether you're on a phone, tablet, or desktop computer.
It's worth testing this consistency yourself across your own actual devices before relying on it, confirming your saved indicators, drawings, and layouts genuinely sync as expected gives confidence in the tool before you depend on it during active trading.
- Written entry/exit rules with zero ambiguity
- Backtested on minimum 3 years of data
- Walk-forward tested on out-of-sample data
- SA-specific events included in test period
- Maximum drawdown within personal tolerance
- 100+ live demo trades with consistent performance
Choosing a trading platform involves balancing familiarity, charting capability, execution reliability, and the availability of features relevant to your specific strategy. South African traders should also verify that their platform of choice remains accessible during load shedding through mobile apps and that it supports the instruments and order types they need. Testing your platform thoroughly on a demo account before relying on it for live trading identifies any usability issues before they cost real money.
4. Feature comparison with built-in platform charts
Some cloud-based charting tools offer more advanced technical analysis features, broader instrument coverage, or more sophisticated drawing and annotation tools than the built-in charting some broker platforms provide directly, though this varies considerably by specific tool and broker platform comparison.
It's worth being specific with yourself about which particular features genuinely matter for your own analysis, rather than assuming more features automatically means better, a cloud platform's broader feature set only adds genuine value if you actually use the specific additional capabilities it offers.
| Win rate | 1:1 RR | 1.5:1 RR | 2:1 RR |
|---|---|---|---|
| 40% | Losing | Break even | Profitable |
| 50% | Break even | Profitable | Profitable |
| 55% | Profitable | Profitable | Profitable |
| 60% | Profitable | Profitable | Profitable |
5. Connecting cloud charting to actual trade execution
Some cloud-based charting platforms offer integration allowing you to execute trades directly through a connected broker account from within the charting interface itself, while others function purely as an analytical tool requiring you to separately place trades through your broker's own platform once your analysis is complete.
It's worth understanding this workflow gap clearly before committing to a cloud-charting-primary approach, discussed elsewhere on this site regarding syncing analysis with execution, the manual transfer step between your cloud analysis and your broker's actual execution platform is worth factoring into your overall trading speed and workflow.
6. Choosing between these two approaches for your own workflow
Many traders use cloud-based charting specifically for deeper, more deliberate analysis sessions, while still executing actual trades through their broker's own dedicated platform, combining these analytical advantages with their broker's specific execution infrastructure.
Cloud charting offers device independence and often more flexibility.
Platform-native charts allow direct order entry from the same interface. Cloud-based charting like TradingView offers device independence, often more customisation, but requires switching to the broker to place trades.
★ Why It Matters
Worth checking: confirm the cloud charting tool's price feed timing matches your actual broker's feed closely enough for your purposes. A charting tool sourcing data from a different provider than your execution broker can occasionally show a meaningfully different real-time price.
✕ Common mistakes
- Not checking feed timing alignment before relying on it for trade decisions. A mismatch can lead to acting on a price that's already moved on your actual platform.
- Treating more advanced charting features as automatically more accurate. Feature richness and data accuracy are separate considerations.
- Switching between cloud and platform charts without noting any discrepancies. Awareness of differences helps avoid confusion during fast-moving moments.
South African traders evaluating trading platforms should verify performance during load shedding conditions, since connectivity reliability is a material operational consideration that traders in other countries do not face. Testing a mobile backup connection through the broker's mobile app on 4G/LTE before going live with real capital confirms that you can manage open positions if your primary internet connection fails during a load shedding window. Most FSCA-regulated brokers provide both desktop and mobile platform versions, and the desktop platform remains the better environment for analysis and strategy execution when full connectivity is available.
Key Takeaways
- Cloud-based charting tools work independently of your specific broker, offering cross-device access and sometimes more advanced features than built-in platform charts.
- Cloud-based charting tools work independently of your specific broker, offering consistent cross-device access.
- They sometimes offer more advanced analytical features than the built-in charting many platforms provide directly.
- How cloud-based charting tools typically work.
- The genuine advantage of broker independence.
Frequently asked follow-up questions
Are cloud-based charting tools free to use?
Many offer free tiers with basic functionality, with more advanced features sometimes requiring a paid subscription.
Do I still need my broker's own platform if I use cloud charting?
Generally yes, for actual order placement and account management, unless your specific cloud tool offers direct broker integration for execution.
Is data accuracy the same between cloud charting and my broker's platform?
Minor discrepancies can sometimes occur given different underlying data sources, making it worth being aware of this possibility when comparing the two side by side.
