i Short answer
A trading dashboard consolidates your key account metrics, watchlists, and pending alerts into a single, organised view.
Ideally this includes current account status, open position summaries, and any alerts relevant to your trading plan.
📋 ON THIS PAGE
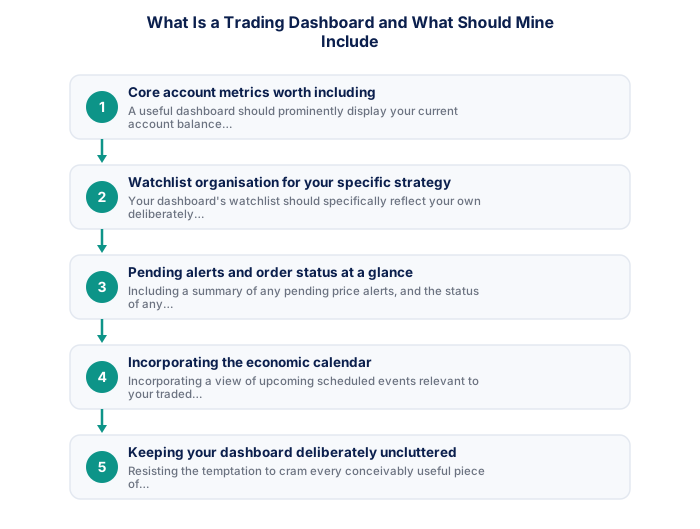
1. Core account metrics worth including
A useful dashboard should prominently display your current account balance and equity, your margin level, relevant to avoiding a margin call, and your overall daily or session profit/loss figure, giving you an immediate, accurate sense of your current account standing without needing to manage multiple separate screens.
2. Watchlist organisation for your specific strategy
Your dashboard's watchlist should specifically reflect your own deliberately limited, well-understood instrument focus, rather than displaying an unfocused, excessive range of instruments you don't actually trade. A focused watchlist supports the broader depth-over-breadth principle that serves most traders well.
- Two-factor authentication enabled
- Unique password not shared with other sites
- Broker mobile app installed and tested
- Mobile data backup connection tested
- Price alerts set for active instruments
- Broker emergency number saved in phone
- Know how to close all positions in under 30 seconds
- Desktop: full charting, multi-monitor, all order types
- Mobile: real-time monitoring and load shedding backup
- Mobile: price alerts when away from desk
- Desktop: useless during load shedding without UPS
- Mobile: limited charting for detailed analysis
- Mobile: higher risk of fat-finger errors
3. Pending alerts and order status at a glance
Including a summary of any pending price alerts and the status of any pending orders on your dashboard gives a quick, complete view of exactly what's currently set up and awaiting potential trigger, without needing to check each individual order or alert separately.
| Feature | MT4 | MT5 |
|---|---|---|
| Broker availability | Very wide | Growing |
| EA library | Largest available | Smaller but growing |
| Timeframes | 9 built-in | 21 built-in |
| Asset classes | Forex and CFDs | Forex, CFDs, stocks |
| Mobile app | Good | More modern UI |
4. Incorporating the economic calendar
Incorporating a view of upcoming scheduled events relevant to your traded instruments directly into your broader dashboard helps maintain this important context readily visible alongside your other key metrics, rather than requiring a separate, additional check each time you want this information.
5. Keeping your dashboard deliberately uncluttered
Resisting the temptation to cram every conceivably useful piece of information onto your dashboard supports clearer, faster comprehension at a glance, which is the entire point of a dashboard's consolidated, summary-level purpose in the first place.
6. Building this using your available platform tools
Most modern broker trading platforms include customisable dashboard or summary screen functionality directly built in, removing the need for separate, additional tools to achieve this consolidated view. Checking your specific platform's customisation options helps you build a dashboard genuinely designed for your own particular trading focus and priorities.
South African traders who maintain a weekly review routine, checking the SARB economic calendar for the coming week, reviewing the Eskom load shedding schedule, assessing the current GNU coalition stability backdrop, and marking key support and resistance levels on the instruments they trade, consistently outperform traders who approach each session without any structured preparation. This weekly routine takes 30 to 45 minutes and produces a clearer analytical framework that reduces impulsive decisions and improves the quality of trade selection throughout the week.
An equity curve and economic calendar add valuable context to daily monitoring.
An essential trading dashboard covers open positions, margin level, and today's P&L at minimum. An equity curve chart and filtered economic calendar add valuable strategic context to daily monitoring.
★ Why It Matters
Worth including, beyond the obvious metrics: a visible reminder of your current maximum daily or weekly loss limit. Dashboards that only show performance after the fact miss the chance to surface your risk boundary before you're deciding whether to take one more trade.
✕ Common mistakes
- Including too many metrics, diluting focus on the genuinely important ones. A few well-chosen indicators tend to be more useful than an exhaustive list.
- Not updating the dashboard consistently alongside your actual trading. An outdated dashboard quickly loses its practical value.
- Treating the dashboard as a one-time setup rather than an evolving tool. It should adapt as your strategy and priorities change.
Key Takeaways
- A trading dashboard consolidates your key metrics and watchlists into a single view, ideally including account status, open positions, and pending alerts.
- A trading dashboard consolidates your key account metrics, watchlists, and pending alerts into a single, organised view.
- Ideally this includes current account status, open position summaries, and any alerts relevant to your trading plan.
- Core account metrics worth including.
- Watchlist organisation for your specific strategy.
If your dashboard lives on a web page, the free trading widget library supplies the individual blocks: rates, charts, an economic calendar and the risk calculators.
Frequently asked follow-up questions
Do I need special software to build a trading dashboard?
Most trading platforms include built-in dashboard or summary screen customisation; dedicated additional software generally isn't necessary for most retail trading purposes.
Should my dashboard look the same on mobile and desktop?
It can be adapted to each device's specific screen size and use case, rather than necessarily identical across both.
How often should I revisit my dashboard setup?
Periodically reviewing whether your dashboard still reflects your current strategy and instrument focus ensures it continues serving your evolving trading approach effectively.
