i Short answer
The VIX measures expected US stock market volatility derived from options pricing, often called the fear index since it rises sharply during market stress.
Some brokers offer CFD exposure to this instrument, letting traders speculate on volatility itself rather than on the direction of underlying prices.
📋 ON THIS PAGE
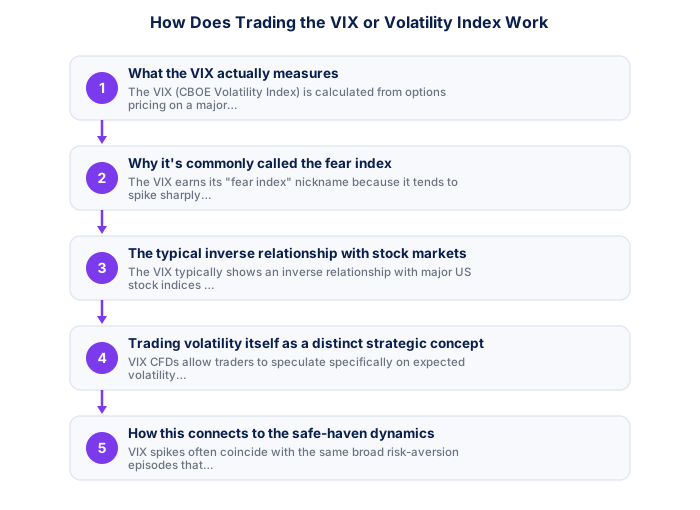
1. What the VIX actually measures
The VIX (CBOE Volatility Index) is calculated from options pricing on a major US stock index, reflecting the market's expectation of volatility over the coming roughly 30-day period. Rather than measuring actual historical volatility the way ATR does, the VIX specifically reflects forward-looking, expected volatility implied by current options market pricing.
It's worth understanding this specific measure as fundamentally distinct from any actual, realised price movement, the VIX reflects the market's current, collective expectation baked into options pricing, not a backward-looking record of how volatile prices have genuinely been recently.
| VIX Range | Typical Market Interpretation |
|---|---|
| Below 15 | Low volatility, calm market conditions |
| 15 to 25 | Normal, moderate volatility |
| 25 to 35 | Elevated volatility, genuine concern |
| Above 35 | High fear, crisis-level conditions |
2. Why it's commonly called the fear index
The VIX earns its "fear index" nickname because it tends to spike sharply during periods of significant market stress or uncertainty, when investors anticipate and price in greater expected future volatility, and tends to settle at lower levels during calmer, more stable market periods when expected future volatility is correspondingly lower.
It's worth noticing the asymmetry in this nickname's framing, the VIX responds far more dramatically to fear and downside uncertainty than to equivalent upside optimism, worth understanding this asymmetric behaviour as a genuine, well-documented feature rather than an inconsistency in how the index works.
- FSCA-regulated broker verified at fsca.co.za
- Demo account tested for minimum 60 days
- Trading plan written: entry, exits, position sizing
- Risk per trade defined (1-2% of account)
- Backup internet connection tested for load shedding
- Tax implications understood
3. The typical inverse relationship with stock markets
The VIX typically shows an inverse relationship with major US stock indices, rising when stock markets fall sharply (reflecting increased fear and expected volatility) and falling when stock markets rise steadily (reflecting calmer, more confident conditions). This inverse relationship, while generally reliable, isn't an absolute, mechanical rule holding in every single circumstance.
It's worth checking this relationship's actual historical strength for yourself rather than assuming it holds perfectly and reliably at all times, while genuinely strong on average, this inverse relationship isn't a fixed, mechanical law and can weaken or behave unusually during specific, atypical market conditions.
4. Trading volatility itself as a distinct strategic concept
VIX CFDs let traders speculate specifically on expected volatility itself as a distinct concept, separate from taking a directional view on whether a specific stock index will rise or fall. This is a genuinely different strategic approach than the more common directional trading, focusing instead on anticipated market turbulence itself as the trading thesis.
It's worth taking real time to understand this distinct conceptual framing before trading VIX products, since it requires genuinely different thinking from the directional analysis, will this specific instrument go up or down, that dominates most other trading discussed throughout this site.
| Item | Detail |
|---|---|
| Regulator | FSCA, fsca.co.za |
| Exchange control | SARB, resbank.co.za |
| Tax authority | SARS, sars.gov.za |
| JSE hours | 09:00-17:00 SAST Mon-Fri |
| Best forex session | 15:00-17:00 SAST |
| CGT annual exclusion | R50,000 (individuals) |
5. How this connects to safe-haven dynamics
VIX spikes often coincide with the same broad risk-aversion episodes that drive safe-haven currency strength and emerging-market currency weakness, including Rand weakness specifically, making VIX levels one additional broader market sentiment indicator some South African traders incorporate into their broader USD/ZAR fundamental analysis.
It's worth incorporating VIX awareness into your broader risk-sentiment assessment specifically when trading emerging-market currencies like the Rand, discussed elsewhere on this site, a sharp VIX spike can serve as a useful, quick signal that broader risk-aversion may be weighing on Rand sentiment independent of any South Africa-specific developments.
6. Practical considerations for trading this specific instrument
VIX CFD trading carries its own specific characteristics worth understanding before trading it directly, including sometimes unusual price behaviour compared to more straightforward directional instruments, given the more complex, options-derived nature of the underlying VIX calculation itself, making this a more specialised instrument better suited to traders who've specifically researched its particular characteristics rather than approaching it identically to more straightforward forex or index CFDs.
For South African traders, it's worth keeping the JSE's own trading hours in mind too, 09:00 to 17:00 SAST on business days, since local shares and indices only move actively within that window regardless of what's happening in global markets overnight.
The VIX tends to spike sharply during a volatility event, then fade more gradually afterward, an asymmetric pattern worth understanding before trading it.
★ Why It Matters
Worth knowing: the VIX tends to spike faster than it falls, market fear shows up abruptly while it fades only gradually. This asymmetry is a structural feature of the index worth understanding before trading any volatility-linked product.
✕ Common mistakes
- Assuming the VIX moves proportionally to actual realised volatility. It reflects expected, options-derived volatility, which can diverge from what later occurs.
- Trading the VIX without understanding its asymmetric spike-and-fade pattern. This shapes both the opportunity and the risk in this instrument.
- Treating a VIX spike as predicting a specific market direction. It reflects expected magnitude of movement, not which direction it will go.
- Not distinguishing short-term VIX trades from longer-term volatility views. The instrument behaves very differently depending on the intended holding period.
Key Takeaways
- The VIX measures expected US stock market volatility, often called the fear index, with some brokers offering CFD exposure to this distinctive instrument.
- The VIX measures expected US stock market volatility derived from options pricing, often called the fear index since it rises sharply during market stress.
- Some brokers offer CFD exposure to this instrument, letting traders speculate on volatility itself rather than on the direction of underlying prices.
- What the VIX actually measures.
- Why it's commonly called the fear index.
If you already understand the index and want the instruments, see how to trade VIX CFDs from South Africa.
See also: Why Has Bitcoin Fallen 45% From Its October 2025 Record High? and Which ETF Should a South African Beginner Actually Buy?.
Frequently asked follow-up questions
Is VIX trading suitable for beginners?
Generally considered more specialised given its more complex, options-derived underlying calculation. Many beginners are better served starting with more straightforward instruments first.
Do all FSCA-regulated brokers offer VIX CFDs?
No, availability varies by broker. Checking your specific broker's instrument range clarifies whether this particular product is accessible to you.
Can VIX levels help predict Rand movement?
VIX can serve as one broader risk-sentiment indicator among several, rather than a standalone, sufficient predictor on its own.
