i Short answer
Sentiment indicators show the proportion of traders currently positioned long versus short on a given instrument.
These are sometimes used as a contrarian signal, given that most retail traders lose money, though this requires important caveats.
📋 ON THIS PAGE
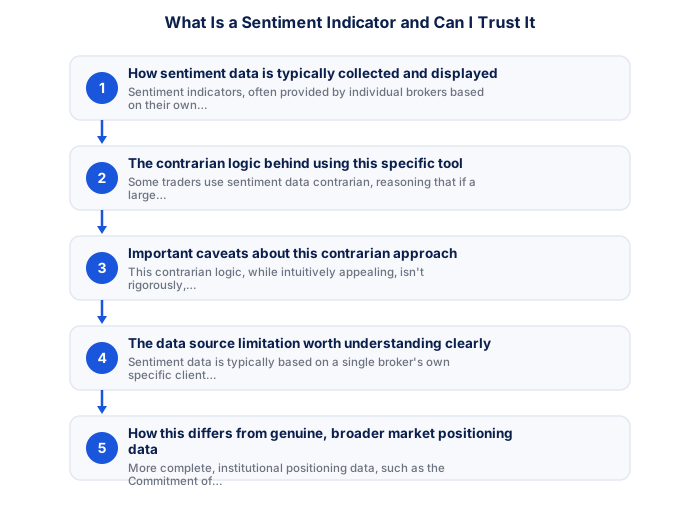
- How sentiment data is typically collected and displayed
- The contrarian logic behind using this specific tool
- Important caveats about this contrarian approach
- The data source limitation worth understanding clearly
- How this differs from genuine, broader market positioning data
- A balanced approach to using sentiment data
1. How sentiment data is typically collected and displayed
Sentiment indicators, often provided by individual brokers based on their own specific client base, display the percentage of clients currently holding long positions versus short positions on a particular instrument, typically updated regularly to reflect current positioning at that broker specifically.
2. The contrarian logic behind using this specific tool
Some traders use sentiment data contrarian, reasoning that if a large majority of retail clients are positioned in one direction, and retail traders statistically tend to be on the wrong side of trades more often than not, taking the opposite position might offer some statistical edge.
- Quantifiable rules remove subjectivity
- Backtestable on historical data
- Works consistently when edge is genuine
- Clear entry/exit criteria reduce hesitation
- Past performance does not guarantee future results
- Risk of overfitting to historical data
- Market regimes change, edges decay
- Requires discipline through drawdown periods
- Price and volume patterns
- Works on any liquid instrument
- Faster to learn basics
- Ignores fundamental context
- Economic and financial data
- Better for longer timeframes
- Deeper knowledge required
- Ignores entry precision
3. Important caveats about this contrarian approach
This contrarian logic, while intuitively appealing, isn't rigorously, consistently validated through sound independent testing the way some other approaches have been more thoroughly examined, extreme sentiment readings don't reliably or consistently predict imminent reversal, and relying on this alone without other confirming analysis carries genuine risk of misapplication.
- Written entry/exit rules with zero ambiguity
- Backtested on minimum 3 years of data
- Walk-forward tested on out-of-sample data
- SA-specific events included in test period
- Maximum drawdown within personal tolerance
- 100+ live demo trades with consistent performance
4. The data source limitation worth understanding clearly
Sentiment data is typically based on a single broker's own specific client base, which represents only a small, potentially unrepresentative sample of the entire global market's actual broader positioning, this limitation means broker-specific sentiment data may not accurately reflect genuinely complete market-wide positioning, reducing its reliability as a standalone signal.
| Win rate | 1:1 RR | 1.5:1 RR | 2:1 RR |
|---|---|---|---|
| 40% | Losing | Break even | Profitable |
| 50% | Break even | Profitable | Profitable |
| 55% | Profitable | Profitable | Profitable |
| 60% | Profitable | Profitable | Profitable |
5. How this differs from genuine, broader market positioning data
More complete, institutional positioning data, such as the Commitment of Traders report published for certain regulated futures markets, provides broader, more representative positioning insight than typical broker-specific retail sentiment indicators, though this kind of complete data isn't directly available for most CFD and forex instruments.
6. A balanced approach to using sentiment data
Given the limitations, using sentiment data as one minor, supplementary input alongside the more established technical and fundamental analysis, rather than as a primary, standalone trading signal, reflects a more appropriately cautious, evidence-aware approach to this particular tool.
South African traders who maintain a weekly review routine, checking the SARB economic calendar for the coming week, reviewing the Eskom load shedding schedule, assessing the current GNU coalition stability backdrop, and marking key support and resistance levels on the instruments they trade, consistently outperform traders who approach each session without any structured preparation. This weekly routine takes 30 to 45 minutes and produces a clearer analytical framework that reduces impulsive decisions and improves the quality of trade selection throughout the week.
The most common mistake when evaluating a trading strategy is judging it on too short a sample. A strategy with a 55% win rate and a 1.5:1 reward-to-risk ratio will produce losing months even under ideal conditions. Over 100 trades, natural variance means any given run of 30 trades could show results ranging from highly profitable to significantly negative, even if the strategy is working exactly as designed. This statistical reality explains why most retail traders abandon strategies prematurely. Meaningful strategy evaluation requires a minimum of 100 trades under consistent market conditions with consistent position sizing and consistent rule-following. Only after this minimum sample is complete can any objective assessment of the strategy's edge begin. South African traders should document each trade against the strategy's specific entry and exit rules, not just the monetary outcome, to build a genuinely useful performance record.
Extreme readings can be contrarian indicators, but still need confirmation.
Sentiment indicators are more useful as context for existing analysis than as standalone entry signals. Extreme readings can be contrarian indicators worth noting, but always need additional confirmation.
★ Why It Matters
Worth testing as a specific contrarian check: when sentiment data shows an extreme, like 90% of retail traders long on a pair, track what actually happened to price over the following days across several such instances, the contrarian signal's reliability seems to vary by how extreme the reading is, not just its direction.
✕ Common mistakes
- Treating sentiment data as a reliable standalone trading signal. It tends to work better combined with other confirming analysis.
- Not testing the contrarian approach against your own traded instruments. Effectiveness can vary meaningfully by instrument and market condition.
- Ignoring how sentiment data sample size affects its reliability. A reading based on few participants carries less statistical weight.
A trading strategy that has not been tested against South African market conditions may behave differently than its global performance suggests. USD/ZAR's sensitivity to domestic political events, load shedding, and SARB rate decisions creates volatility patterns that global backtesting databases may not fully capture. Including specific SA-market periods in any strategy evaluation, such as the March 2020 COVID and Moody's downgrade period, the 2024 election run-up, and sustained Stage 6 load shedding intervals, provides a more realistic assessment of how the strategy will perform under conditions that South African traders regularly experience.
Analytical tools and frameworks add value only to the extent that they improve your actual trading decisions rather than providing reassurance or filling time between trades. The most effective approach to adopting new analytical tools is to paper-trade with them for a defined period, comparing outcomes against your results without the tool, before integrating them into your live trading process. South African traders should additionally assess whether any tool they consider incorporates SA-specific data sources, particularly SARB data, JSE specific feeds, and local economic calendar data, since global tools default to non-ZAR market data that may not fully capture the drivers relevant to their primary instruments.
Key Takeaways
- Sentiment indicators show the proportion of traders positioned long versus short on an instrument, sometimes used contrarian given retail trading statistics.
- Sentiment indicators show the proportion of traders currently positioned long versus short on a given instrument.
- These are sometimes used as a contrarian signal, given that most retail traders lose money, though this requires important caveats.
- How sentiment data is typically collected and displayed.
- The contrarian logic behind using this specific tool.
Frequently asked follow-up questions
Do all brokers offer sentiment indicator tools?
Availability varies; some brokers provide this as a built-in platform feature, while others don't offer this specific tool at all.
Is sentiment data the same as correlation or heat map tools?
No, these are distinct concepts; sentiment specifically reflects trader positioning, while correlation and heat maps reflect price movement relationships and relative performance respectively.
Should I ever trade purely based on sentiment data alone?
This isn't generally recommended given the limitations involved. Combining sentiment with other confirming analysis supports more sound decision-making.
