i Short answer
Price action trading analyses raw price movement and chart patterns directly from candlesticks and historical structure.
This is without relying primarily on the calculated technical indicators many other approaches use as their main tool.
📋 ON THIS PAGE
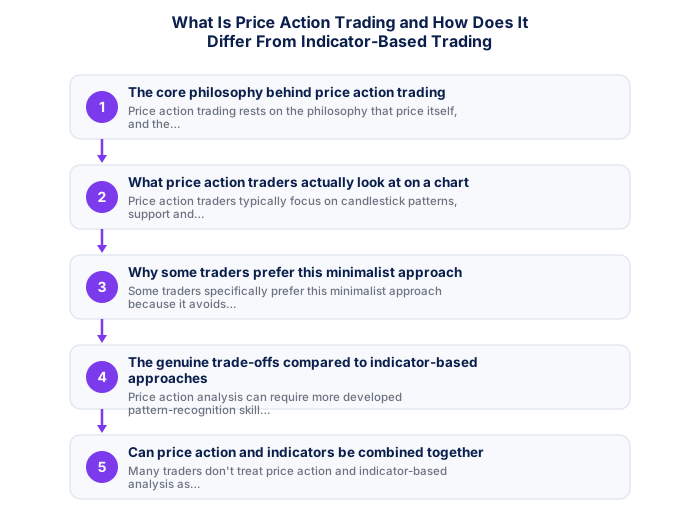
- The core philosophy behind price action trading
- What price action traders actually look at on a chart
- Why some traders prefer this minimalist approach
- The genuine trade-offs compared to indicator-based approaches
- Can price action and indicators be combined together
- Learning price action analysis as a developed skill
1. The core philosophy behind price action trading
Price action trading rests on the philosophy that price itself, and the patterns it forms, represents the most direct, unfiltered reflection of actual market participant behaviour, while calculated indicators are simply derivative transformations of this same underlying price data, potentially introducing lag or distortion rather than adding genuinely new information.
It's worth understanding the underlying reasoning here, price action traders generally argue that indicators are simply mathematical derivatives of the same underlying price data, worth analysing directly rather than through a lagging, derived filter, discussed elsewhere on this site regarding indicator lag generally.
2. What price action traders actually look at on a chart
Price action traders typically focus on candlestick patterns, support and resistance levels, overall trend structure and market context, and sometimes volume, analysing these elements directly from a relatively "clean" chart without the additional visual clutter that multiple overlaid indicators can introduce.
It's worth practising identifying these specific elements deliberately on historical charts, discussed elsewhere on this site regarding chart practice generally, since genuine price action fluency requires considerably more repeated pattern recognition practice than simply reading an indicator's numeric output.
- Quantifiable rules remove subjectivity
- Backtestable on historical data
- Works consistently when edge is genuine
- Clear entry/exit criteria reduce hesitation
- Past performance does not guarantee future results
- Risk of overfitting to historical data
- Market regimes change, edges decay
- Requires discipline through drawdown periods
- Price and volume patterns
- Works on any liquid instrument
- Faster to learn basics
- Ignores fundamental context
- Economic and financial data
- Better for longer timeframes
- Deeper knowledge required
- Ignores entry precision
3. Why some traders prefer this minimalist approach
Some traders prefer this minimalist approach because it avoids the indicator overload that comes from combining too many tools simultaneously, and because it forces direct engagement with raw price behaviour rather than potentially relying on indicators as a kind of analytical shortcut that might substitute for genuinely understanding underlying market structure and behaviour.
It's worth appreciating this preference as a genuine, valid stylistic choice rather than an objectively superior method, some traders genuinely find a cleaner chart supports clearer thinking, while others find indicators provide useful, valuable structure, worth discovering your own preference through actual experience with both.
- Written entry/exit rules with zero ambiguity
- Backtested on minimum 3 years of data
- Walk-forward tested on out-of-sample data
- SA-specific events included in test period
- Maximum drawdown within personal tolerance
- 100+ live demo trades with consistent performance
4. The genuine trade-offs compared to indicator-based approaches
Price action analysis can require more developed pattern-recognition skill and experience to interpret effectively compared to following more explicit, quantified indicator signals, which can feel more objective and accessible, particularly for newer traders still developing this kind of intuitive chart-reading fluency.
It's worth being honest with yourself about the genuine learning curve involved here, price action analysis typically takes longer to develop real proficiency in than learning to read a handful of indicators, worth budgeting realistic time for this specific skill development.
| Win rate | 1:1 RR | 1.5:1 RR | 2:1 RR |
|---|---|---|---|
| 40% | Losing | Break even | Profitable |
| 50% | Break even | Profitable | Profitable |
| 55% | Profitable | Profitable | Profitable |
| 60% | Profitable | Profitable | Profitable |
5. Can price action and indicators be combined together
Many traders don't treat price action and indicator-based analysis as mutually exclusive, instead using price action as their primary analytical foundation while selectively incorporating a small number of indicators for specific additional confirmation, rather than viewing this as a strict either-or choice between two entirely separate philosophies.
It's worth experimenting with this combined approach yourself rather than treating price action and indicators as mutually exclusive camps, many experienced traders genuinely use both together, discussed elsewhere on this site regarding confluence, price action for primary structure and indicators for supporting confirmation.
6. Learning price action analysis as a developed skill
Developing genuine price action skill benefits from deliberate, historical chart practice, building the kind of pattern-recognition fluency that purely indicator-following might not develop as directly, given price action's more direct engagement with raw chart structure, part of learning technical analysis properly.
The most common mistake when evaluating a trading strategy is judging it on too short a sample. A strategy with a 55% win rate and a 1.5:1 reward-to-risk ratio will produce losing months even under ideal conditions. Over 100 trades, natural variance means any given run of 30 trades could show results ranging from highly profitable to significantly negative, even if the strategy is working exactly as designed. This statistical reality explains why most retail traders abandon strategies prematurely. Meaningful strategy evaluation requires a minimum of 100 trades under consistent market conditions with consistent position sizing and consistent rule-following. Only after this minimum sample is complete can any objective assessment of the strategy's edge begin. South African traders should document each trade against the strategy's specific entry and exit rules, not just the monetary outcome, to build a genuinely useful performance record.
Indicators are mathematical derivatives of price and always lag.
Price action trading reads raw candlesticks and market structure without lagging indicators. Indicators are mathematical derivatives of price that always lag the move they're describing, though both approaches can be combined effectively.
★ Why It Matters
Worth testing: try trading a strategy on a completely blank chart, with no indicators at all, for a set period. Traders who've relied heavily on indicators sometimes discover they were unconsciously reading price action anyway, the indicators were confirming what they'd have noticed regardless.
✕ Common mistakes
- Assuming indicator-based and price-action approaches can't be combined. Many traders blend both rather than choosing one exclusively.
- Treating price action skill as something that develops without deliberate practice. It typically takes the same focused repetition any other technical skill requires.
- Relying entirely on indicators without understanding the underlying price movement they're derived from. Indicators are calculations based on price, not an independent source of information.
Key Takeaways
- Price action trading analyses raw price movement and chart patterns directly, without relying primarily on calculated technical indicators for decision-making.
- Price action trading analyses raw price movement and chart patterns directly from candlesticks and historical structure.
- This is without relying primarily on the calculated technical indicators many other approaches use as their main tool.
- The core philosophy behind price action trading.
- What price action traders actually look at on a chart.
Frequently asked follow-up questions
Is price action trading more difficult to learn than indicator-based trading?
It can require more developed pattern-recognition skill, though both approaches ultimately require the same kind of dedicated practice the genuine learning timeline calls for.
Do professional traders favour price action over indicators?
Preferences vary considerably among experienced traders. Neither approach has demonstrated definitively superior overall reliability through rigorous, broad evidence.
Yes, the underlying analytical approach can be applied across day trading, swing trading, and position trading styles, adapted to each style's timeframe.
