i Short answer
Win rate measures the percentage of trades that result in a profit out of all trades taken.
It matters only in combination with the risk-reward ratio, not as a standalone metric considered in isolation. Our Break Even Win Rate Calculator works out the exact minimum win rate a given risk-reward setup needs to avoid losing money.
📋 ON THIS PAGE
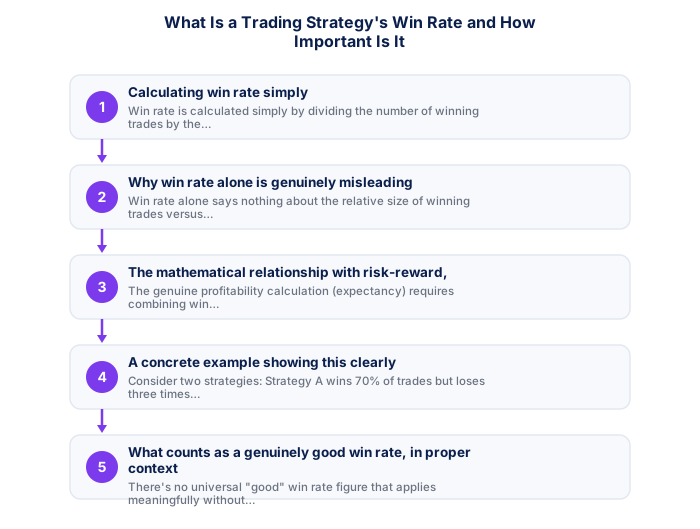
1. Calculating win rate simply
Win rate is calculated simply by dividing the number of winning trades by the total number of trades taken, expressed as a percentage. A strategy producing 60 winning trades out of 100 total trades has a 60% win rate. This calculation itself is straightforward, though its proper interpretation requires important additional context.
It's worth calculating this figure specifically from a genuinely large enough sample, discussed elsewhere on this site regarding sample size requirements for edge verification, a win rate calculated from only a handful of trades tells you considerably less than one calculated from dozens or hundreds.
2. Why win rate alone is genuinely misleading
Win rate alone says nothing about the relative size of winning trades versus losing trades. A strategy could have a very high win rate but still be unprofitable overall if its average losses are disproportionately larger than its average wins, or conversely, a relatively low win rate strategy can still be genuinely profitable if its winning trades are sufficiently larger than its losing trades.
It's worth internalising this specifically because win rate is often the first, most intuitively appealing statistic newer traders focus on, understanding early why this single figure alone doesn't determine profitability helps you develop a more sophisticated, accurate view of what genuinely makes a strategy sound.
- Quantifiable rules remove subjectivity
- Backtestable on historical data
- Works consistently when edge is genuine
- Clear entry/exit criteria reduce hesitation
- Past performance does not guarantee future results
- Risk of overfitting to historical data
- Market regimes change, edges decay
- Requires discipline through drawdown periods
- Price and volume patterns
- Works on any liquid instrument
- Faster to learn basics
- Ignores fundamental context
- Economic and financial data
- Better for longer timeframes
- Deeper knowledge required
- Ignores entry precision
3. The mathematical relationship with risk-reward
The genuine profitability calculation (expectancy, relevant to trading edge verification) requires combining win rate with average win and loss size together. Neither figure alone determines overall profitability; only their combination, properly calculated, reveals whether a strategy genuinely has positive expectancy.
It's worth calculating your own strategy's specific breakeven win rate given its actual typical risk-reward ratio, discussed elsewhere on this site, rather than assuming a generic figure applies universally, since this breakeven threshold shifts depending on your own specific ratio.
- Written entry/exit rules with zero ambiguity
- Backtested on minimum 3 years of data
- Walk-forward tested on out-of-sample data
- SA-specific events included in test period
- Maximum drawdown within personal tolerance
- 100+ live demo trades with consistent performance
4. A concrete example showing this clearly
Consider two strategies: Strategy A wins 70% of trades but loses three times more on losing trades than it gains on winning trades, producing negative overall expectancy despite its impressively high win rate. Strategy B wins only 35% of trades but gains three times more on winning trades than it loses on losing trades, producing positive overall expectancy despite its seemingly unimpressive win rate. This concrete contrast illustrates why win rate alone is a genuinely incomplete, potentially misleading metric.
It's worth working through a few variations of this example yourself, changing the specific win rate and risk-reward figures, seeing how the relationship between these two variables plays out across different combinations builds a genuinely intuitive understanding beyond memorising a single illustrative case.
| Win rate | 1:1 RR | 1.5:1 RR | 2:1 RR |
|---|---|---|---|
| 40% | Losing | Break even | Profitable |
| 50% | Break even | Profitable | Profitable |
| 55% | Profitable | Profitable | Profitable |
| 60% | Profitable | Profitable | Profitable |
5. What counts as a genuinely good win rate, in proper context
There's no universal "good" win rate figure that applies meaningfully without considering the corresponding risk-reward ratio. A 40% win rate can be genuinely excellent if paired with a sufficiently favourable risk-reward ratio, while a 70% win rate can be genuinely poor if paired with a sufficiently unfavourable one. Evaluating win rate always requires this paired context, never in isolation.
It's worth resisting any temptation to judge your own strategy's win rate against a generic external benchmark, a win rate that would be genuinely concerning for one strategy's typical risk-reward profile can be perfectly healthy for another, worth evaluating your own figure specifically within your own strategy's full context.
6. Calculating your own strategy's actual win rate
Calculating your own genuine win rate requires a trading journal, tracking every trade's outcome honestly across a meaningful sample size, then combining this figure with your actual average win and loss size to calculate genuine expectancy, rather than evaluating win rate as a standalone, sufficient metric on its own.
Win rate alone is meaningless without knowing the reward-to-risk ratio. A 33% win rate is profitable with a 1:2 ratio, while a 70% win rate can lose money if winners are far smaller than losers.
★ Why It Matters
Worth calculating alongside win rate: your strategy's expectancy per trade, which combines win rate with average win and loss size. A strategy with a 30% win rate and strongly asymmetric risk-reward can be considerably more profitable than one with a 60% win rate and poor risk-reward.
✕ Common mistakes
- Evaluating win rate without its paired average win and loss size. A lower win rate with strong risk-reward can outperform a high win rate with poor risk-reward.
- Assuming a higher win rate always means a better strategy. Overall expectancy, not win rate alone, determines genuine profitability.
- Chasing a higher win rate by cutting winners short. This can hurt overall expectancy even while the win rate number improves.
- Not calculating expectancy directly from your own actual statistics. This combined figure is more informative than win rate viewed in isolation.
Key Takeaways
- Win rate measures the percentage of profitable trades, but matters only in combination with risk-reward ratio for genuinely assessing overall profitability.
- Win rate measures the percentage of trades that result in a profit out of all trades taken.
- It matters only in combination with the risk-reward ratio, not as a standalone metric considered in isolation.
- Calculating win rate simply.
- Why win rate alone is genuinely misleading.
Frequently asked follow-up questions
Is a 50% win rate considered average for trading strategies?
There's no universal average figure, since this varies considerably by specific strategy and trading style. The more meaningful question is always how win rate combines with risk-reward ratio.
Should I prioritise a high win rate when designing a strategy?
Not in isolation. Designing a strategy around overall positive expectancy matters more than optimising win rate alone without this broader context.
Can win rate change significantly over time for the same strategy?
Yes, market conditions can shift, making ongoing tracking more reliable than a single historical figure.
