i Short answer
Leading indicators attempt to predict future price movement before it occurs, while lagging indicators confirm trends already underway.
Each involves genuine trade-offs between earlier signals and greater reliability.
📋 ON THIS PAGE
1. Defining leading indicators with examples
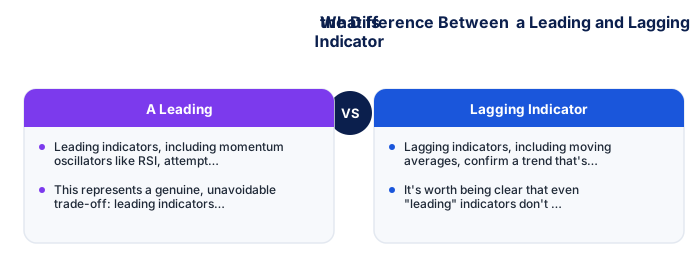
Leading indicators, including momentum oscillators like RSI, attempt to signal a potential future price movement before it has fully developed, often by measuring the rate or strength of recent price change to anticipate exhaustion or reversal. These indicators aim to provide earlier signals than waiting for a trend to be fully, visibly established.
It's worth appreciating the genuine trade-off this category involves, since 'leading' doesn't mean 'more accurate,' these indicators attempt to anticipate future movement specifically at the cost of generating more false signals than their lagging counterparts typically produce.
2. Defining lagging indicators with examples
Lagging indicators, including moving averages, confirm a trend that's already underway, calculated from historical price data that, by definition, reflects what has already happened rather than anticipating what will happen next. These indicators provide later, but generally more reliable, confirmation of an established trend's actual direction.
See also: Momentum Trading vs Trend Following
It's worth understanding why this delay is a genuine, unavoidable trade-off rather than a flaw, discussed elsewhere on this site regarding the persistent lag problem, lagging indicators confirm what's already happening with greater reliability precisely because they wait for more evidence before signalling.
- Quantifiable rules remove subjectivity
- Backtestable on historical data
- Works consistently when edge is genuine
- Clear entry/exit criteria reduce hesitation
- Past performance does not guarantee future results
- Risk of overfitting to historical data
- Market regimes change, edges decay
- Requires discipline through drawdown periods
- Price and volume patterns
- Works on any liquid instrument
- Faster to learn basics
- Ignores fundamental context
- Economic and financial data
- Better for longer timeframes
- Deeper knowledge required
- Ignores entry precision
3. The fundamental trade-off between the two categories
This represents a genuine, unavoidable trade-off: leading indicators offer earlier signals but with greater risk of false signals, since they're attempting to anticipate something that hasn't fully occurred yet, while lagging indicators offer greater reliability but necessarily later signals, since by the time a lagging indicator confirms a trend, a meaningful portion of that trend's movement may have already occurred.
It's worth internalising this trade-off as a genuine, unavoidable choice rather than searching for an indicator that somehow avoids it entirely, no indicator can be simultaneously earlier and more reliable, worth accepting this limitation as a basic feature of technical analysis generally.
- Written entry/exit rules with zero ambiguity
- Backtested on minimum 3 years of data
- Walk-forward tested on out-of-sample data
- SA-specific events included in test period
- Maximum drawdown within personal tolerance
- 100+ live demo trades with consistent performance
| Feature | Leading Indicator | Lagging Indicator |
|---|---|---|
| When it signals | Before a move develops | After a trend is established |
| Primary use | Entry timing, anticipating reversals | Trend confirmation, filtering noise |
| False signal risk | Higher: many signals don't follow through | Lower: confirms established moves |
| Examples | RSI, Stochastic, Williams %R | Moving averages, MACD, Bollinger Bands |
| Best in ranging markets | More useful | Less reliable: whipsaws common |
| Best in trending markets | Can give early exit signals | Follows the trend cleanly |
| SA macro examples | PMI, SARB leading indicator | GDP, CPI, unemployment rate |
4. Why no indicator genuinely predicts the future with certainty
It's worth being clear that even "leading" indicators don't predict the future with certainty, they simply use current and recent data to generate an earlier estimate or signal than purely lagging measures would provide, while still carrying genuine uncertainty about whether that signal will actually play out as anticipated.
It's worth returning to this principle whenever a specific indicator feels unusually compelling or reliable, discussed throughout this site's technical analysis content, every indicator, leading or lagging, operates within the same fundamentally probabilistic, uncertain framework that all trading analysis shares.
| Win rate | 1:1 RR | 1.5:1 RR | 2:1 RR |
|---|---|---|---|
| 40% | Losing | Break even | Profitable |
| 50% | Break even | Profitable | Profitable |
| 55% | Profitable | Profitable | Profitable |
| 60% | Profitable | Profitable | Profitable |
5. Combining both categories thoughtfully within a strategy
Many traders combine both indicator categories deliberately, using a leading indicator for earlier signal generation, then requiring confirmation from a lagging indicator before actually committing to a trade, similar in spirit to the multi-indicator confirmation approach. This combination aims to capture some of each category's benefit while mitigating its respective weakness.
It's worth experimenting with this combined approach specifically through backtesting, discussed elsewhere on this site regarding backtesting generally, confirming through your own historical analysis whether pairing a leading indicator's earlier signal with a lagging indicator's confirmation genuinely improves your specific strategy's results.
6. Which category suits which trading style
Shorter-term trading styles, often place relatively more weight on leading indicators given their need for earlier signals within compressed timeframes, while longer-term swing and position trading styles, can more comfortably rely on lagging confirmation given their longer holding periods, where a slightly later entry matters proportionally less relative to the overall intended move.
Lagging indicators confirm after the move with fewer false signals.
Leading indicators signal before a potential move, useful for timing but prone to false signals. Lagging indicators confirm after the move is already underway, more reliable but entering later in the trend.
★ Why It Matters
Something worth testing directly: combine one of each type deliberately, using the leading indicator for early warning and the lagging indicator for confirmation, rather than relying on either category alone, this pairing approach tends to address each type's individual weakness somewhat.
✕ Common mistakes
- Relying exclusively on one category without the other. Each type carries genuine trade-offs between earlier signals and greater reliability.
- Assuming a leading indicator's early signal is automatically more reliable. Earlier timing often comes paired with reduced confirmation.
- Not testing the specific combination of leading and lagging indicators you use. Personal backtesting reveals whether your particular pairing genuinely adds value.
- Treating all leading indicators as equally predictive. Reliability varies considerably between different leading indicators.
Key Takeaways
- Leading indicators attempt to predict future price movement, while lagging indicators confirm trends already underway, each with distinct trade-offs.
- Leading indicators attempt to predict future price movement before it occurs, while lagging indicators confirm trends already underway.
- Each involves genuine trade-offs between earlier signals and greater reliability.
- Defining leading indicators with examples.
- Defining lagging indicators with examples.
See also: What Indicators Work Best for Short-Term Trading?.
Frequently asked follow-up questions
Is RSI always considered a leading indicator?
RSI is commonly categorised as a leading or momentum indicator, though its specific predictive reliability still carries the same general uncertainty as all leading indicators.
Can a single indicator be both leading and lagging depending on context?
Some indicators have characteristics of both, or can be configured differently; the leading versus lagging categorisation is often more of a general tendency than an absolute, fixed classification.
Should beginners start with leading or lagging indicators?
Many trading educators suggest lagging indicators like moving averages, as a more straightforward starting point given their generally clearer, more reliable signals for those still building foundational skill.
