i Short answer
Overfitting occurs when a strategy is excessively tuned to fit historical data's specific quirks, performing impressively in backtests but poorly on new, unseen data.
This happens because the strategy has effectively memorised random noise rather than capturing a genuine, repeatable edge.
📋 ON THIS PAGE
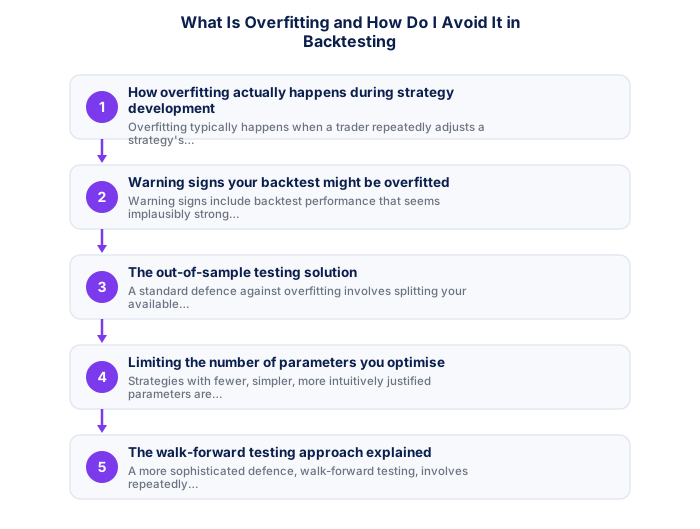
1. How overfitting actually happens during strategy development
Overfitting typically happens when a trader repeatedly adjusts a strategy's specific parameters, indicator periods, entry thresholds, stop-loss distances, specifically to maximise historical backtest performance on one particular dataset, eventually arriving at a parameter combination that happens to fit that specific historical period's particular quirks extremely well, without this fit reflecting any genuine, underlying market pattern likely to persist going forward.
It's worth understanding this as an almost inevitable temptation during backtesting rather than a mistake only careless traders make, the ease of adjusting a parameter and immediately seeing improved historical results creates a genuine, seductive pull toward exactly this kind of excessive fitting.
Fitting parameters to historical data produces strategies that look excellent in backtests and fail immediately live. Always reserve out-of-sample data for final validation.
See also: What Is Algorithmic Trading and Can South Africans Use Trading Bots?
2. Warning signs your backtest might be overfitted
Warning signs include backtest performance that seems implausibly strong compared to realistic expectations, a strategy with numerous specific, finely-tuned parameters rather than a few broad, intuitive rules, and performance that varies dramatically with very small parameter adjustments, suggesting the strategy's apparent edge is fragile and specific to particular historical conditions rather than sound and generalisable.
It's worth checking your own strategy honestly against these specific warning signs, an unusually smooth equity curve with minimal drawdown, discussed elsewhere on this site regarding realistic equity curves, or performance that seems too good relative to known market realities are both worth treating as genuine red flags.
- Quantifiable rules remove subjectivity
- Backtestable on historical data
- Works consistently when edge is genuine
- Clear entry/exit criteria reduce hesitation
- Past performance does not guarantee future results
- Risk of overfitting to historical data
- Market regimes change, edges decay
- Requires discipline through drawdown periods
- Price and volume patterns
- Works on any liquid instrument
- Faster to learn basics
- Ignores fundamental context
- Economic and financial data
- Better for longer timeframes
- Deeper knowledge required
- Ignores entry precision
3. The out-of-sample testing solution
A standard defence against overfitting involves splitting your available historical data into two segments, an "in-sample" period used for developing and tuning your strategy, and a separate "out-of-sample" period, not used at all during development, used purely to test whether the strategy's performance holds up on data it was never tuned against specifically.
A strategy showing strong in-sample performance but considerably weaker out-of-sample performance is a clear, concrete sign of overfitting, while a strategy showing reasonably consistent performance across both segments provides more genuine confidence in its underlying robustness.
- Written entry/exit rules with zero ambiguity
- Backtested on minimum 3 years of data
- Walk-forward tested on out-of-sample data
- SA-specific events included in test period
- Maximum drawdown within personal tolerance
- 100+ live demo trades with consistent performance
4. Limiting the number of parameters you optimise
Strategies with fewer, simpler, more intuitively justified parameters are generally less prone to overfitting than strategies with many finely-tuned parameters, since each additional parameter you optimise against historical data increases the statistical risk of fitting noise rather than genuine, underlying signal, connecting to the broader principle of avoiding indicator overload.
It's worth counting your own strategy's adjustable parameters explicitly, a strategy with numerous tunable settings carries genuinely higher overfitting risk than a simpler one with only a few, worth favouring simplicity specifically for this reason, not just for its own sake.
| Win rate | 1:1 RR | 1.5:1 RR | 2:1 RR |
|---|---|---|---|
| 40% | Losing | Break even | Profitable |
| 50% | Break even | Profitable | Profitable |
| 55% | Profitable | Profitable | Profitable |
| 60% | Profitable | Profitable | Profitable |
5. The walk-forward testing approach explained
A more sophisticated defence, walk-forward testing, involves repeatedly re-optimising your strategy on a rolling historical window and then testing the resulting parameters on the immediately following, not-yet-seen period, repeating this process forward through your entire available dataset. This approach more closely simulates how a strategy would genuinely be used and re-tuned in real, ongoing practice, providing a more realistic robustness assessment than a single in-sample/out-of-sample split alone.
It's worth treating this as your primary defence against overfitting specifically, discussed in more detail elsewhere on this site regarding walk-forward testing, since it directly tests whether your strategy's edge genuinely generalises beyond the specific historical data it was originally developed against.
6. A practical mindset for avoiding this trap
Beyond these specific technical defences, maintaining a sceptical mindset toward any backtest result that seems unusually, implausibly strong, and favouring strategies built on genuine, intuitive logical reasoning about why a pattern should work, rather than purely data-mined parameter combinations discovered through extensive trial and error, supports a more disciplined, overfitting-resistant approach to strategy development generally.
It's worth adopting a genuine scepticism toward impressively strong backtest results as your default stance, rather than excitement, a healthy suspicion of results that seem unusually good protects you from the natural human tendency to want to believe you've found something genuinely exceptional.
The most common mistake when evaluating a trading strategy is judging it on too short a sample. A strategy with a 55% win rate and a 1.5:1 reward-to-risk ratio will produce losing months even under ideal conditions. Over 100 trades, natural variance means any given run of 30 trades could show results ranging from highly profitable to significantly negative, even if the strategy is working exactly as designed. This statistical reality explains why most retail traders abandon strategies prematurely. Meaningful strategy evaluation requires a minimum of 100 trades under consistent market conditions with consistent position sizing and consistent rule-following. Only after this minimum sample is complete can any objective assessment of the strategy's edge begin. South African traders should document each trade against the strategy's specific entry and exit rules, not just the monetary outcome, to build a genuinely useful performance record.
A sound strategy performs consistently on both known and unseen data.
Overfitting occurs when a strategy is optimised so specifically to historical data that it fails to work on new, unseen data. Fewer, more general rules and a walk-forward test help distinguish sound from overfitted strategies.
★ Why It Matters
Worth applying as a specific rule: if your strategy requires more than roughly 3-4 adjustable parameters to perform well historically, treat that complexity itself as a warning sign, simpler strategies with fewer tunable knobs tend to overfit less even when their backtested returns look less spectacular.
✕ Common mistakes
- Adding excessive parameters to make historical results look better. More than 3-4 adjustable parameters is itself a meaningful warning sign.
- Treating an impressive backtest as sufficient without forward or walk-forward testing. These additional steps specifically guard against overfitting that backtesting alone can miss.
- Not testing the strategy's sensitivity to small parameter changes. A strategy that collapses from minor tweaks was likely fit to historical noise.
- Optimising repeatedly against the same historical dataset. Repeated optimisation on identical data increases overfitting risk with each pass.
Key Takeaways
- Overfitting occurs when a strategy is excessively tuned to historical data, performing impressively in backtests but poorly on genuinely new, unseen data.
- Overfitting occurs when a strategy is excessively tuned to fit historical data's specific quirks, performing impressively in backtests but poorly on new, unseen data.
- This happens because the strategy has effectively memorised random noise rather than capturing a genuine, repeatable edge.
- How overfitting actually happens during strategy development.
- Warning signs your backtest might be overfitted.
Frequently asked follow-up questions
How much historical data should I reserve for out-of-sample testing?
Common approaches reserve a meaningful portion, sometimes 20-30% of available data, though the specific proportion can vary based on your total available dataset size and strategy type.
Can overfitting happen with manual, non-coded backtesting too?
Yes, even manual backtesting can suffer from this if you repeatedly adjust your discretionary rules specifically to fit how a particular historical period played out, rather than maintaining consistent, predetermined criteria throughout.
Is a strategy with very few parameters automatically free from overfitting risk?
Fewer parameters reduce but don't entirely eliminate this risk; even simple strategies can be inadvertently selected because they happened to perform well on the specific tested period, making out-of-sample validation valuable regardless of strategy simplicity.
