i Short answer
Fibonacci retracement levels identify potential support and resistance zones based on specific mathematical ratios derived from the Fibonacci sequence. Our Fibonacci Retracement Calculator works out these exact levels from any swing high and low.
They are widely used by traders, though subject to the same mixed evidence as technical analysis generally.
📋 ON THIS PAGE
- The mathematical basis explained simply
- How traders actually draw and use these levels
- The honest evidence behind Fibonacci levels specifically
- Why these levels might work partly as a self-fulfilling pattern
- Combining Fibonacci levels with other confirmation
- A balanced approach to using this specific tool
1. The mathematical basis explained simply
The Fibonacci sequence is a mathematical pattern where each number is the sum of the two preceding numbers, and certain ratios derived from this sequence (particularly 61.8%, sometimes called the "golden ratio") appear repeatedly across various natural and mathematical contexts. Fibonacci retracement levels apply these specific ratios to a recent significant price move, identifying potential levels where price might pause or reverse during a pullback.
It's worth being clear-eyed about the leap involved here: the fact that certain ratios appear in natural phenomena like shell spirals or plant growth patterns doesn't, on its own, prove those same ratios have genuine predictive power in financial markets. That connection is a claim worth evaluating on its own trading evidence, discussed below, rather than accepting simply because the underlying mathematics has genuine elegance in other contexts.
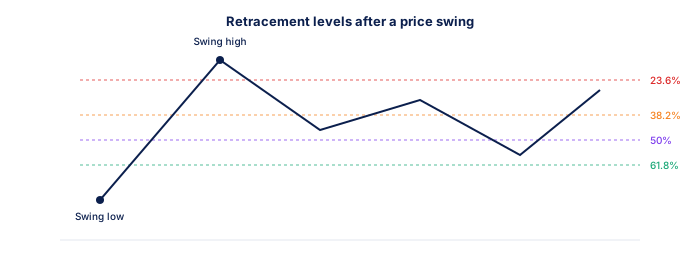
| Level | Typical Interpretation |
|---|---|
| 23.6% | Shallow retracement |
| 38.2% | Moderate retracement |
| 50% | Not a true Fibonacci ratio, but widely watched |
| 61.8% | Deep retracement, the "golden ratio" |
2. How traders actually draw and use these levels
Practically, a trader identifies a significant recent price swing (from a notable low to a notable high, or vice versa), then draws Fibonacci retracement levels between these two points using standard charting tool functionality. The resulting horizontal lines at each Fibonacci ratio then become potential support or resistance levels to watch as price retraces from its recent extreme.
Choosing which swing high and low to use is itself a judgement call, and it's where a good deal of the subjectivity discussed elsewhere around technical analysis creeps into this specific tool. Two traders looking at the identical chart can reasonably select different swing points and arrive at meaningfully different retracement levels, worth keeping in mind before treating any single drawn level as objectively correct.
- FSCA-regulated broker verified at fsca.co.za
- Demo account tested for minimum 60 days
- Trading plan written: entry, exits, position sizing
- Risk per trade defined (1-2% of account)
- Backup internet connection tested for load shedding
- Tax implications understood
3. The honest evidence behind Fibonacci levels specifically
Like technical analysis generally, rigorous statistical testing of Fibonacci retracement levels has produced genuinely mixed results, similar to the broader mixed evidence around many widely-used technical tools. Some studies find modest statistical tendencies around these levels, while others find limited support once rigorous testing is properly applied.
This mixed picture is worth holding onto specifically because Fibonacci levels are sometimes presented in trading education content with more mathematical certainty than the evidence actually supports. Treating the underlying ratios as a proven law of market behaviour, rather than a moderately popular tool with genuinely mixed statistical backing, sets up expectations the tool isn't equipped to reliably meet.
4. Why these levels might work partly as a self-fulfilling pattern
Similar to the self-fulfilling prophecy dynamic in technical analysis broadly, Fibonacci levels' widespread popularity among traders means many market participants watch and react to the same levels simultaneously, potentially creating genuine, if partly self-reinforcing, significance at these levels purely through this widespread collective attention, regardless of any independent mathematical validity of the underlying Fibonacci ratios themselves.
This has a practical implication worth acting on: the more standard and widely recognised a specific Fibonacci level is, the 61.8% retracement in particular, the more plausible this self-fulfilling effect becomes, simply because more traders are likely watching that specific, commonly-cited ratio compared to some of the less frequently discussed Fibonacci extensions and ratios.
| Item | Detail |
|---|---|
| Regulator | FSCA, fsca.co.za |
| Exchange control | SARB, resbank.co.za |
| Tax authority | SARS, sars.gov.za |
| JSE hours | 09:00-17:00 SAST Mon-Fri |
| Best forex session | 15:00-17:00 SAST |
| CGT annual exclusion | R50,000 (individuals) |
5. Combining Fibonacci levels with other confirmation
Many traders combine Fibonacci levels with support and resistance analysis, looking for situations where a Fibonacci retracement level coincides with an independently-identified support or resistance zone, treating this confluence as giving more meaningful confirmation than either signal alone, consistent with the broader principle of combining multiple analytical inputs.
This combination approach is arguably where Fibonacci levels earn their keep most reliably. Used purely alone, a Fibonacci level is one trader's subjective line on a chart; used specifically to flag where it's worth paying closer attention because it overlaps with an independently identified support or resistance zone, it becomes a genuinely useful piece of a broader, more sound analytical picture.
6. A balanced approach to using this specific tool
A balanced, evidence-aware approach to Fibonacci levels involves treating them as one additional input within a broader analytical framework, combining them with other confirmation, and personally testing your own application through backtesting, rather than either dismissing this widely-used tool entirely or treating it as a reliably precise, standalone predictive system.
Like any tool drawn on a chart, it is worth testing against your own data before trading it. Running it through a backtest alongside your usual trading plan shows whether it adds anything.
They don't predict price with certainty and need confirmation to be useful.
Fibonacci retracement levels identify commonly watched price zones. They're self-fulfilling to some degree because many traders watch them, but don't predict price with certainty and need additional confirmation.
★ Why It Matters
Worth testing on yourself: mark Fibonacci levels on a chart, then check whether price genuinely reacted at those exact levels more than at other comparably "round" price levels nearby. Some of Fibonacci's apparent reliability may reflect that round numbers attract reactions generally, not the specific ratios themselves.
✕ Common mistakes
- Assuming Fibonacci levels work identically regardless of instrument or timeframe. Reliability appears to vary across different markets and chart settings.
- Relying on Fibonacci retracement alone without other confirming analysis. It tends to work better combined with additional technical signals.
- Drawing Fibonacci levels inconsistently from different swing points. Inconsistent anchor points can produce considerably different, unreliable levels.
Key Takeaways
- Fibonacci retracement levels identify potential support and resistance based on mathematical ratios, widely used though with the same mixed evidence as other tools.
- Fibonacci retracement levels identify potential support and resistance zones based on specific mathematical ratios derived from the Fibonacci sequence.
- They are widely used by traders, though subject to the same mixed evidence as technical analysis generally.
- The mathematical basis explained simply.
- How traders actually draw and use these levels.
See also: Which Technical Indicators Do South African Traders Rely On? and What Is the Difference Between a Breakout and a Fakeout?.
Frequently asked follow-up questions
Which Fibonacci ratio is considered most significant?
The 61.8% level is commonly discussed as particularly significant among traders, though no single ratio has demonstrated definitively superior reliability through rigorous independent testing.
Can Fibonacci levels be used on any timeframe?
Yes, the same underlying calculation can be applied across any chart timeframe, from very short-term to long-term charts.
Do professional traders actually use Fibonacci levels?
Usage varies considerably among professional traders. Some incorporate it as one tool among many, while others don't use it at all, reflecting the mixed evidence above.
