i Short answer
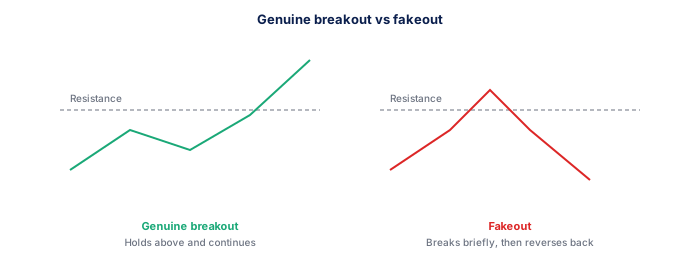
A genuine breakout sustains momentum beyond a key support or resistance level, while a fakeout briefly breaches the level before reversing back.
Distinguishing between these in advance is genuinely difficult, making risk management around breakout trades particularly important.
📋 ON THIS PAGE
1. What a genuine breakout typically looks like
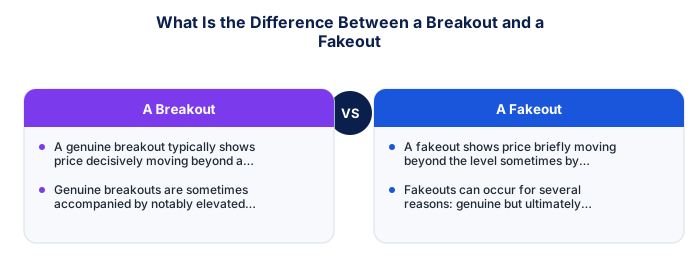
A genuine breakout typically shows price decisively moving beyond a previously identified support or resistance level, and continuing to hold or extend beyond that level over subsequent price bars, rather than immediately stalling or reversing. This sustained continuation reflects genuine, sufficient buying or selling pressure to overcome whatever historical significance that level previously held.
It's worth studying historical examples of genuine breakouts on your own traded instruments, discussed elsewhere on this site regarding chart practice, building visual familiarity with how authentic breakouts typically develop and sustain helps you distinguish them more reliably from fakeouts in real time.
| Signal | Likely Genuine Breakout | Likely Fakeout |
|---|---|---|
| Volume | Noticeably above average | Low or average |
| Candle size | Large decisive candle body | Small, indecisive candle |
| Retest of broken level | Holds as new support/resistance | Price returns through the level |
| Market context | Trending market, news catalyst aligned | Ranging market, no fundamental driver |
| Session timing | London or NY session open | Low-volume Asian session |
| Confirmation candle | Second candle confirms direction | Price reverses immediately |
| Broader market alignment | Same direction as related pairs/indices | Isolated move, rest of market flat |
2. What a fakeout typically looks like
A fakeout shows price briefly moving beyond the level, sometimes by only a small margin, before quickly reversing back within the previous range, effectively trapping traders who entered based on the initial breach with a position that quickly moves against them as price reverses, illustrating exactly why this pattern is sometimes called a "bull trap" or "bear trap" depending on the specific direction involved.
See also: Can I Change My Account's Base Currency Later?
It's worth reviewing your own trading history specifically for fakeout instances you've encountered, understanding the specific pattern that preceded each one builds your personal, evidence-based sense of what warning signs to watch for in your own future trading.
- FSCA-regulated broker verified at fsca.co.za
- Demo account tested for minimum 60 days
- Trading plan written: entry, exits, position sizing
- Risk per trade defined (1-2% of account)
- Backup internet connection tested for load shedding
- Tax implications understood
3. Why fakeouts happen mechanically
Fakeouts can occur for several reasons: genuine but ultimately insufficient buying or selling pressure that briefly pushes price beyond the level before more dominant opposing pressure reasserts itself, or in some cases, larger market participants deliberately triggering stop-loss orders, clustered just beyond a well-known level, before reversing direction once these triggered orders have been absorbed.
It's worth appreciating the genuine market mechanics behind this pattern, discussed elsewhere on this site regarding whipsaw specifically, insufficient genuine conviction behind an initial break, combined with profit-taking or opposing orders at the level, can produce exactly this kind of reversal.
4. Volume as a potential confirmation tool
Genuine breakouts are sometimes accompanied by notably elevated trading volume, reflecting genuine, broad market participation in the move, while fakeouts sometimes show comparatively weaker volume, suggesting the initial breach wasn't supported by genuinely broad, committed market participation.
It's worth checking whether your specific traded instrument provides reliable volume data before building your fakeout-filtering approach around this specific criterion, discussed elsewhere on this site regarding forex's decentralised structure, since genuine volume figures aren't equally available across every instrument.
| Item | Detail |
|---|---|
| Regulator | FSCA, fsca.co.za |
| Exchange control | SARB, resbank.co.za |
| Tax authority | SARS, sars.gov.za |
| JSE hours | 09:00-17:00 SAST Mon-Fri |
| Best forex session | 15:00-17:00 SAST |
| CGT annual exclusion | R50,000 (individuals) |
5. Waiting for confirmation versus entering immediately
Some traders specifically wait for additional confirmation beyond the initial breach, perhaps requiring price to close beyond the level on a specific timeframe, or requiring a brief pullback and successful retest of the broken level, before entering, sacrificing some potential profit from the earliest part of a genuine move in exchange for reduced fakeout risk.
It's worth backtesting both approaches specifically for your own strategy, discussed elsewhere on this site regarding backtesting generally, confirming through your own historical data whether the reduced fakeout risk from waiting genuinely outweighs the less favourable entry price this patience typically costs.
6. Risk management specifically suited to breakout trades
Given the genuine difficulty distinguishing breakouts from fakeouts in advance, applying disciplined stop-loss placement, calibrated to limit losses if a breakout trade turns out to be a fakeout, remains essential, accepting that some breakout trades will inevitably be fakeouts is a normal, expected part of this particular strategy approach, rather than a sign of analytical failure each time it happens.
Whichever method you use, sizing stops and targets from what the instrument actually does beats a round number. volatility
A fakeout reverses quickly, often with no volume confirmation.
A genuine breakout continues beyond the level with volume confirmation and a candle close outside the range. A fakeout reverses quickly, often without meaningful volume, trapping traders who entered on the initial move.
★ Why It Matters
Worth backtesting : the percentage of breakouts at a given level that held versus reversed within your own traded instrument and timeframe over recent months, this single piece of personal data is more useful for calibrating your own risk management than any general breakout statistic.
✕ Common mistakes
- Assuming you can reliably distinguish the two in the moment, every time. This distinction is genuinely difficult to make in advance, which is exactly why risk management matters here.
- Trading every apparent breakout with full position size regardless of confirmation. Reduced initial size or added confirmation criteria can manage this genuine uncertainty.
- Treating a single failed breakout as proof the technique doesn't work. A reasonable failure rate is built into and expected from this kind of setup.
Key Takeaways
- A genuine breakout sustains momentum beyond a key level, while a fakeout briefly breaches the level before reversing, often trapping early entrants.
- A genuine breakout sustains momentum beyond a key support or resistance level, while a fakeout briefly breaches the level before reversing back.
- Distinguishing between these in advance is genuinely difficult, making risk management around breakout trades particularly important.
- What a genuine breakout typically looks like.
- What a fakeout typically looks like.
See also: What Is Support and Resistance and How Do I Identify It? and What Is a Golden Cross and Death Cross in Trading? and What Is MACD and How Do Traders Use It?.
Frequently asked follow-up questions
Can fakeouts be completely avoided with the right strategy?
Not entirely; some fakeout risk is an inherent, accepted part of breakout trading generally, making sound risk management more valuable than attempting to eliminate this risk entirely.
Are fakeouts more common on certain timeframes?
Shorter timeframes can sometimes show more frequent fakeouts given their generally higher noise level, though this varies by specific instrument and market conditions.
Does waiting for confirmation guarantee avoiding fakeouts entirely?
No, confirmation approaches reduce but don't eliminate this risk entirely, since even confirmed breakouts can occasionally still reverse afterward.
