i Short answer
A performance dashboard consolidates key trading statistics, like win rate, average risk-reward, and equity curve, into one consolidated view.
This supports more efficient, regular review than scattered, separate records.
📋 ON THIS PAGE
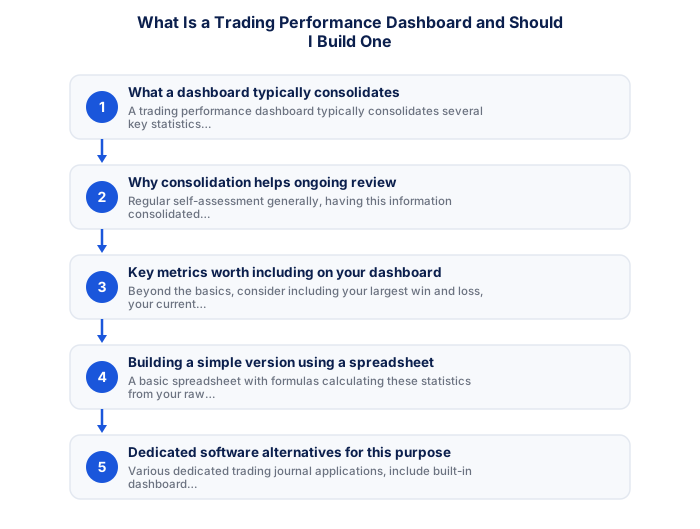
1. What a dashboard typically consolidates
A trading performance dashboard consolidates several key statistics into a single view: win rate, average risk-reward ratio, total trades taken, profit factor, maximum drawdown, and overall equity curve. Rather than reviewing each metric separately across different reports or tabs, a dashboard presents them together so the relationship between them is immediately visible.
The value of that consolidation isn't aesthetic, it's analytical. Win rate alone is nearly meaningless without the average risk-reward ratio. Maximum drawdown means something different depending on whether it occurred across five trades or five hundred. A dashboard that shows these metrics together enables the kinds of connections that reviewing each metric in isolation prevents.
Most traders who build a dashboard report that the most useful insight isn't any single metric but rather the relationship between metrics they hadn't previously examined together, a high win rate that masks a poor risk-reward ratio, or a consistent strategy being undermined by a handful of large outlier losses that aren't visible in the monthly P&L figure.
2. Why consolidation genuinely helps ongoing review
Regular performance review is one of the habits most reliably associated with trading improvement, but it only happens consistently when the barrier to doing it is low. A dashboard that automatically calculates your key metrics from your trade log removes the friction that turns an important review into something you defer indefinitely.
Having this information consolidated and current also changes how you engage with your trading between sessions. Instead of a general sense of how things are going, you have a precise picture that makes it easier to spot emerging patterns, a gradual decline in average risk-reward, a growing variance in position sizing, a strategy that performs differently in different market conditions.
- Two-factor authentication enabled
- Unique password not shared with other sites
- Broker mobile app installed and tested
- Mobile data backup connection tested
- Price alerts set for active instruments
- Broker emergency number saved in phone
- Know how to close all positions in under 30 seconds
- Desktop: full charting, multi-monitor, all order types
- Mobile: real-time monitoring and load shedding backup
- Mobile: price alerts when away from desk
- Desktop: useless during load shedding without UPS
- Mobile: limited charting for detailed analysis
- Mobile: higher risk of fat-finger errors
There's also a discipline benefit that's worth naming explicitly. When your performance metrics are clearly visible and easy to access, the temptation to avoid reviewing them during difficult periods is lower than when review requires gathering data from multiple places. Forced transparency with yourself is one of the more uncomfortable but productive habits a trader can build.
3. Key metrics worth including on your dashboard
Beyond win rate and average risk-reward, a well-designed dashboard should include profit factor (gross profit divided by gross loss, where anything above 1.0 is profitable), maximum drawdown as a percentage of peak equity, and a rolling equity curve that shows growth or decline visually over time. These together tell a more complete performance story than any single number.
Consider including your largest individual win and loss, not because the outliers define your strategy, but because large outliers reveal whether your risk management is consistent. A strategy with a maximum loss ten times larger than your average loss has a sizing problem that the average figures mask. Similarly, your largest win being far above average might indicate you're letting winners run inconsistently.
| Feature | MT4 | MT5 |
|---|---|---|
| Broker availability | Very wide | Growing |
| EA library | Largest available | Smaller but growing |
| Timeframes | 9 built-in | 21 built-in |
| Asset classes | Forex and CFDs | Forex, CFDs, stocks |
| Mobile app | Good | More modern UI |
A breakdown of performance by setup type, instrument, or session time can also be genuinely revealing once you have sufficient trade volume. Understanding where your edge actually resides, which specific conditions produce your best outcomes, is more actionable than an aggregate performance figure that blends profitable and unprofitable conditions together.
4. Building a simple version using a spreadsheet
A basic spreadsheet is genuinely sufficient for a first dashboard. A trade log with columns for date, instrument, direction, entry price, exit price, position size, risk amount, and result in pips or currency feeds formulas that automatically calculate win rate, average risk-reward, profit factor, and maximum drawdown. The formulas involved are straightforward and templates are freely available.
The discipline of maintaining the trade log accurately is more important than the sophistication of the dashboard built on top of it. A dashboard built on selective or inaccurate data produces misleading conclusions. Entering trades consistently and honestly, including the uncomfortable ones, is the foundation that makes any dashboard meaningful.
Google Sheets or Excel both work well for this purpose. Keeping the log in a cloud-based spreadsheet means it's accessible from any device, automatically backed up, and easy to share with a mentor or trading partner if you want an external review of your performance data.
5. Dedicated software alternatives for this purpose
Several dedicated trading journal applications include built-in dashboard functionality that automatically calculates performance metrics from your imported trade log. These tools typically offer richer visualisations, better filtering capabilities, and more granular analysis than a manually maintained spreadsheet, at the cost of a subscription fee.
For traders whose trade volume justifies the additional investment, dedicated journal software reduces the maintenance overhead of keeping metrics current and provides analytical depth that spreadsheets achieve only with significant custom formula work. Some platforms also connect directly to certain brokers to import trade data automatically, removing manual entry entirely.
Before committing to a paid tool, it's worth verifying that your specific broker is supported for automatic import, since manual data entry significantly reduces the convenience advantage of dedicated software. Most tools offer a trial period adequate for testing this compatibility.
6. How often to actually review your dashboard
Many traders find a weekly or monthly review cadence provides a good balance between staying genuinely informed and avoiding the anxiety-driven checking that intraday performance monitoring can trigger. The specific cadence matters less than consistency, a thorough monthly review done reliably is more useful than sporadic deeper dives.
Worth including deliberately alongside the standard metrics: a rolling measure of rule-adherence rate, not just profit and loss. A dashboard that tracks whether you followed your plan on each trade reveals whether performance problems stem from strategy weakness or execution inconsistency, which is the single most important distinction for diagnosing and correcting underperformance.
After significant events, a large loss, a winning streak, or a change in market conditions, an additional unscheduled review is worth doing. These inflection points in your equity curve often carry the most actionable information about what's working, what isn't, and whether your current approach is genuinely suited to the conditions you're currently trading.
✕ Common mistakes
- Building a dashboard focused only on outcomes, not process metrics. Rule-adherence rate predicts continued good results better than past profit alone.
- Not updating the dashboard consistently alongside actual trading activity. Inconsistent updates undermine its usefulness over time.
- Including too many metrics without prioritising the genuinely actionable ones. A focused set of indicators tends to be more useful than an exhaustive one.
- Treating the dashboard as a one-time project rather than an evolving tool. It should be revised as your strategy and priorities develop.
Key Takeaways
- A performance dashboard consolidates key trading statistics into one view, supporting more efficient ongoing review than scattered, separate records.
- A performance dashboard consolidates key trading statistics, like win rate, average risk-reward, and equity curve, into one consolidated view.
- This supports more efficient, regular review than scattered, separate records.
- What a dashboard typically consolidates.
- Why consolidation genuinely helps ongoing review.
Frequently asked follow-up questions
Do I need programming skills to build a spreadsheet dashboard?
No, basic spreadsheet formulas, widely documented in free online tutorials, are generally sufficient without requiring any genuine programming knowledge.
Should my dashboard include emotional or psychological notes too?
Some traders do include this alongside quantitative statistics, providing additional valuable context beyond purely numerical performance metrics.
Can a dashboard help me identify when my strategy needs adjustment?
Yes, tracking these metrics consistently over time can help reveal gradual performance shifts worth investigating further.
Is it worth paying for dedicated journal software instead of a free spreadsheet?
This depends on your own specific preferences around convenience versus cost. Both approaches can provide genuine value depending on your particular needs.
Should I share my dashboard with a mentor or accountability partner?
Some traders find this valuable, for additional external perspective on their own documented performance.
