i Short answer
A risk-reward ratio of at least 1:1.5 to 1:2 is commonly recommended, meaning your profit target should be 1.5 to 2 times larger than what you're risking.
This allows a strategy to remain profitable over time even with a win rate below 50%. Tracking each trade's result as an R multiple makes this ratio easy to monitor consistently over time.
📋 ON THIS PAGE
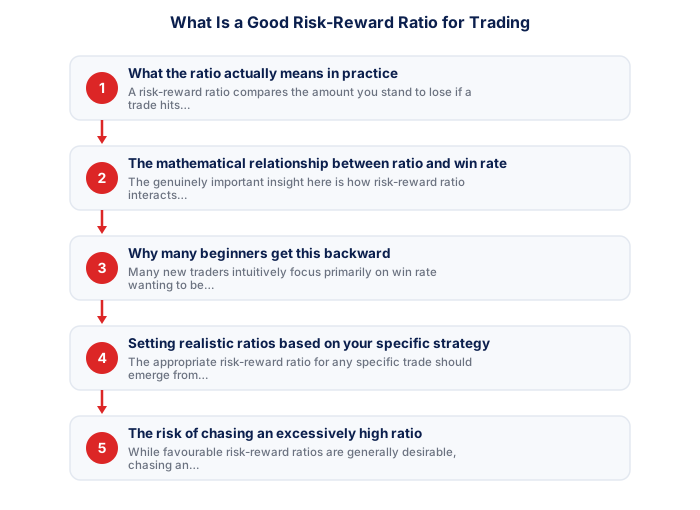
1. What the ratio actually means in practice
A risk-reward ratio compares the amount you stand to lose if a trade hits your stop-loss against the amount you stand to gain if it hits your take-profit target. A 1:2 ratio means that for every R100 you're risking, your target aims to capture R200 in profit if the trade works out. This ratio is determined before you ever open the trade, based on where you place your stop-loss relative to your entry and your profit target.
This predetermined nature connects directly to broader discipline-building practices around stop-loss and take-profit orders. Calculating and committing to a specific risk-reward ratio before opening a trade is itself a concrete expression of the predetermined-rules approach to trading discipline.
| Risk-Reward Ratio | Minimum Win Rate to Break Even |
|---|---|
| 1:1 | 50% |
| 1:2 | 33% |
| 1:3 | 25% |
2. The mathematical relationship between ratio and win rate
The genuinely important insight here is how risk-reward ratio interacts mathematically with win rate to determine overall profitability. With a 1:2 risk-reward ratio, a strategy only needs to win roughly 33% of its trades to break even, and anything above that threshold becomes genuinely profitable over a large enough sample, a considerably lower bar than the 50%+ win rate many beginners mistakenly assume is necessary for a viable strategy.
This means a strategy with a relatively modest win rate can still be genuinely profitable if its risk-reward ratio is favourable enough, while a strategy with a high win rate but poor risk-reward ratio (frequently winning small amounts but occasionally losing large amounts) can actually be unprofitable overall despite winning more often than it loses.
- D = Drawdown as decimal (e.g. 0.25 = 25%)
- 25% drawdown = needs 33% to recover
- 50% drawdown = needs 100% to recover
- 75% drawdown = needs 300% to recover
This 33% breakeven figure is worth holding onto as a genuine reference point, since it reframes what "good enough" actually looks like. A trader who loses more often than they win, roughly six times out of ten in this example, can still be a consistently profitable trader, provided the ratio discipline behind each trade is maintained. That's a meaningfully different mental model from the instinctive assumption that being right most of the time is what trading success requires.
3. Why many beginners get this backward
Many new traders intuitively focus primarily on win rate, wanting to be "right" as often as possible, without giving equal attention to the size of wins relative to losses. This often leads to a damaging pattern: taking profits very quickly (locking in small wins to feel good about a high win rate) while letting losing trades run longer than planned, hoping for a reversal, exactly the inverse of a favourable risk-reward approach, and a pattern connecting directly to loss-aversion psychology.
Recognising this common bias explicitly, that a strategy's overall profitability depends on the combination of win rate and risk-reward ratio together, not win rate alone, is one of the more valuable mathematical reframes a newer trader can internalise early in their development.
- Position size calculated before every entry
- Stop-loss defined from chart structure before entry
- Total open risk below 5% of account at any time
- No adding to losing positions under any circumstances
- Trading paused if monthly drawdown reaches 10%
- Stops never moved further away once position is open
This pattern is worth watching for specifically in your own trading journal, since it's easy to recognise in the abstract while missing it in your own actual behaviour. Comparing your planned exit levels against where you actually closed each trade, across enough trades to see a genuine pattern, is a more reliable way to catch this tendency than simply trying to remember whether you've been doing it.
4. Setting realistic ratios based on your specific strategy
The appropriate risk-reward ratio for any specific trade should emerge from genuine technical or fundamental analysis, where a sound stop-loss level and a sound profit target actually sit based on chart structure, support and resistance levels, or other strategy-specific criteria, rather than being forced to fit an arbitrary predetermined ratio regardless of what the actual price structure suggests.
Some strategies, by their nature, tend to produce favourable risk-reward setups frequently (certain trend-following or breakout approaches, for example), while others may naturally produce tighter ratios closer to 1:1, requiring a correspondingly higher win rate to remain profitable. Understanding your own strategy's natural risk-reward tendencies through backtesting is more useful than applying a generic ratio target without this context.
| Drawdown | Recovery needed | At 20%/yr | At 10%/yr |
|---|---|---|---|
| 10% | 11.1% | 7 months | 14 months |
| 25% | 33.3% | 19 months | 38 months |
| 50% | 100.0% | 4+ years | 7+ years |
| 75% | 300.0% | Never at 10%/yr | Never at 10%/yr |
This is one of the clearer reasons backtesting earns its place as a genuinely useful step rather than an optional extra. Two strategies can look similar on paper while producing very different natural risk-reward profiles once tested against real historical data, and knowing your specific strategy's actual tendency removes the guesswork from deciding what ratio to realistically expect and plan around.
5. The risk of chasing an excessively high ratio
While favourable risk-reward ratios are generally desirable, chasing an excessively high ratio (for example, insisting on 1:5 or higher on every trade) can sometimes mean setting profit targets so distant from the entry price that they're rarely actually reached before the market reverses, potentially resulting in a very low win rate that, despite the attractive ratio on paper, still produces poor overall results in practice.
This illustrates why risk-reward ratio shouldn't be optimised in isolation. It needs to be considered alongside the realistic win rate your specific strategy and target actually achieve in practice, which is precisely what backtesting and forward-testing are designed to reveal through genuine evidence rather than theoretical assumption.
A useful sanity check when a target looks unusually distant: ask whether the level was chosen because genuine technical or fundamental analysis points to it, or simply because it produces an appealing ratio number. Working backward from a desired ratio to a target price, rather than forward from actual analysis to wherever that analysis happens to land, is exactly the kind of arbitrary target-setting that tends to produce disappointing real-world results.
6. Tracking your actual achieved ratio over time
Beyond the ratio you target when planning a trade, tracking your actual achieved risk-reward ratio across your real trade history, recorded in your trading journal, reveals whether your actual execution matches your planning. It's common for traders to plan favourable ratios but, due to psychological factors like closing winners early or letting losers run, achieve a meaningfully worse ratio in actual practice than their stated strategy intends.
This gap between planned and achieved ratio is genuinely useful diagnostic information, often revealing specific psychological discipline issues that are otherwise easy to overlook without this kind of honest, systematic comparison between intention and actual execution.
Reviewing this gap on a regular schedule, rather than only when results have been disappointing, helps catch drift early, before it compounds across many trades. A small, consistent shortfall between planned and achieved ratio is far easier to correct once identified than a pattern that's gone unexamined for months of trading.
A 1:2 risk-reward ratio only requires a 33% win rate to be profitable, compared to above 50% for a 1:1 ratio. Risk-reward and win rate work together, neither alone determines profitability.
★ Why It Matters
Worth calculating directly from your own data: your strategy's actual win rate alongside its risk-reward ratio together. A 1:3 ratio with a 25% win rate is mathematically identical in expectancy to a 1:1 ratio with a 50% win rate, the ratio alone tells you very little without its paired win rate.
✕ Common mistakes
- Assuming a higher ratio is always better regardless of win rate trade-offs. Very high ratios often come with correspondingly lower win rates.
- Not calculating your own strategy's actual combined expectancy. This single number is more informative than the ratio alone.
- Treating commonly cited ratios as universally appropriate for every strategy. The right ratio depends on your specific strategy's actual statistics.
Key Takeaways
- A risk-reward ratio of at least 1:1.5 to 1:2 is commonly recommended, meaning potential profit should exceed potential loss on each trade. Learn why this matters.
- A risk-reward ratio of at least 1:1.5 to 1:2 is commonly recommended, meaning your profit target should be 1.5 to 2 times larger than what you're risking.
- This allows a strategy to remain profitable over time even with a win rate below 50%.
- What the ratio actually means in practice.
- The mathematical relationship between ratio and win rate.
See also: Can I Retire Early in South Africa? and How Do I Actually Make Money Online in South Africa?.
Frequently asked follow-up questions
Is a 1:1 risk-reward ratio ever acceptable?
Yes, if your strategy demonstrates a sufficiently high win rate (above 50%) through genuine testing to remain profitable at this ratio, though most strategies benefit from at least some favourable skew above 1:1.
Should I always use the same risk-reward ratio on every trade?
Not necessarily, some traders adjust targets based on specific technical levels for each trade, though maintaining a generally consistent minimum threshold (such as never accepting worse than 1:1.5) provides useful discipline.
Does a higher risk-reward ratio always mean a better strategy?
Not in isolation, it needs to be considered alongside the realistic win rate that ratio actually produces in practice, since an attractive ratio with a very low corresponding win rate may not be genuinely profitable overall.
Can risk-reward ratio change partway through a trade?
The planned ratio is generally fixed at entry, though some traders adjust their stop-loss or target as a trade develops, using trailing stops, which effectively changes the ratio dynamically as the position evolves.
Is risk-reward ratio more important than win rate?
Neither factor is more important in isolation. What matters is their combined effect on overall expectancy, since a strategy's genuine profitability depends on how these two figures interact together.
