i Short answer
A drawdown calculator measures the percentage decline from a previous peak account value to a subsequent lower point, automating the calculation.
This helps assess whether current losses fall within historically normal ranges for your strategy, rather than relying on rough estimation.
📋 ON THIS PAGE
- The basic drawdown calculation formula
- Calculating this manually versus using a dedicated tool
- Tracking current drawdown versus maximum historical drawdown
- Using this tool during backtesting specifically
- Setting a personal drawdown threshold for yourself
- Where to find this functionality practically
- Drawdown in practice: the JSE's own 2026
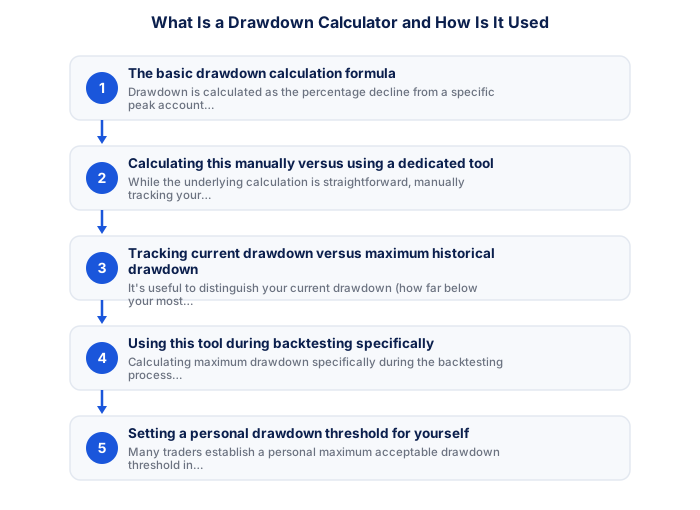
1. The basic drawdown calculation formula
Drawdown is calculated as the percentage decline from a specific peak account value to a subsequent trough value, before any new peak is reached, for example, an account declining from a peak of R12,000 to a low of R9,000 before recovering represents a 25% drawdown, calculated as the R3,000 decline divided by the R12,000 peak.
| Item | Value |
|---|---|
| Peak account value | R12,000 |
| Trough (low point) | R9,000 |
| Decline | R3,000 |
| Drawdown | 25% (R3,000 ÷ R12,000) |
2. Calculating this manually versus using a dedicated tool
While the underlying calculation is straightforward, manually tracking your account's peak value and calculating drawdown after every individual trade becomes tedious over an extended period, a dedicated drawdown calculator, whether built into trading journal software or a simple spreadsheet formula, automates this ongoing tracking considerably more efficiently.
3. Tracking current drawdown versus maximum historical drawdown
It's useful to distinguish your current drawdown (how far below your most recent peak your account currently sits) from your maximum historical drawdown (the largest such decline your account or strategy has ever experienced), both figures provide useful but distinct information about your account's risk profile and current standing relative to its historical pattern.
4. Using this tool during backtesting specifically
Calculating maximum drawdown specifically during the backtesting process helps reveal a strategy's worst-case historical decline, providing important risk context beyond simply knowing the strategy's overall historical profitability, since a strategy with impressive average returns but extreme historical drawdown carries genuinely different risk characteristics than one with more modest returns but considerably gentler historical drawdown.
5. Setting a personal drawdown threshold for yourself
Many traders establish a personal maximum acceptable drawdown threshold in advance, treating reaching this threshold as a clear signal to pause trading and conduct a thorough strategy review, similar in spirit to the daily loss limits used for overtrading prevention, just applied at a longer-term, cumulative account level.
6. Where to find this functionality practically
Many trading journal applications and backtesting platforms include built-in drawdown calculation and visualisation, often displaying this as a chart showing your account's drawdown pattern over time, removing the need for manual calculation while providing a more intuitive, visual understanding of your account's historical risk pattern.
Many of these calculations become more robust when paired with a volatility measure like the Average True Range (ATR), which adjusts automatically to current market conditions rather than relying on a fixed assumption that may no longer fit.
A drawdown calculator reveals your maximum peak-to-trough loss, and critically, the disproportionately larger gain needed to recover it. A 50% drawdown requires a 100% gain just to break even.
★ Why It Matters
Worth calculating for your own strategy: the recovery percentage needed after a given drawdown. A 20% drawdown requires a 25% gain just to break even. This asymmetry is exactly why limiting drawdown size matters more than it might intuitively seem.
✕ Common mistakes
- Tracking drawdown only at the end of a losing period, not throughout. Ongoing tracking reveals the full picture, not just the final number.
- Assuming manual tracking is sufficiently accurate without periodic double-checking. A dedicated calculator reduces manual calculation errors over time.
- Ignoring drawdown duration in addition to its depth. How long a drawdown lasts matters as much as how deep it goes.
Drawdown in practice: the JSE's own 2026
Drawdown is easier to grasp from a real series than from a definition, and the JSE All Share supplied one this year. The index reached a record 129,339 in March 2026, slid through the middle of the year to 115,306 by early August, and had recovered to around 116,700 by early September.
Peak to trough, that is a decline of roughly 10.8%. The recovery from 115,306 back to the March peak requires a gain of about 12.2%, which is the asymmetry a drawdown calculator exists to make visible: the percentage needed to recover is always larger than the percentage lost, and the gap widens sharply as the loss grows.
At a 10% loss the required recovery is 11.1%, which feels manageable. At 30% it is 42.9%. At 50% it is 100%, meaning the account has to double simply to return to where it started. This is the arithmetic behind the standard advice to cap risk per trade, and it does not depend on any view about markets.
The JSE episode also shows the time dimension. The index took about five months to fall and had not recovered its March level six months later. An account in drawdown is not only smaller, it is unable to compound from the previous high for however long the recovery takes, and that lost compounding rarely appears in a performance table.
Used before trading rather than after, a drawdown calculation sets a maximum tolerable loss and works backwards to a position size that keeps a normal losing streak inside it.
| Drawdown | Gain needed to recover |
|---|---|
| 10% | 11.1% |
| 20% | 25.0% |
| 30% | 42.9% |
| 50% | 100% |
| 70% | 233% |
Frequently asked follow-up questions
Is a higher maximum drawdown always worse?
Generally yes for comparable strategies, though this needs to be weighed against overall returns and risk-reward characteristics, rather than considered entirely in isolation.
Should I panic if I hit my predetermined drawdown threshold?
No, treating this calmly as a predetermined signal for review, rather than an emotional crisis, supports a more disciplined, constructive response.
Can drawdown be calculated for a single trading day, not just overall account history?
Yes, the same underlying calculation can be applied to any specific period you want to examine, including daily, weekly, or monthly drawdown patterns.
Will my stop fill at the price I set?
The level is a trigger, not a promise. In a fast market the fill can be several points worse. stop-loss against mental stop covers it in full.
Should I move my stop to breakeven?
It is a real improvement on a trending instrument and an expensive habit on a choppy one. Stop-loss against mental stop covers it in full.
