i Short answer
A correlation matrix displays current correlation coefficients across many instrument pairs simultaneously, in a single grid.
This supports quick diversification checks and risk assessment across an entire multi-instrument portfolio at once.
📋 ON THIS PAGE
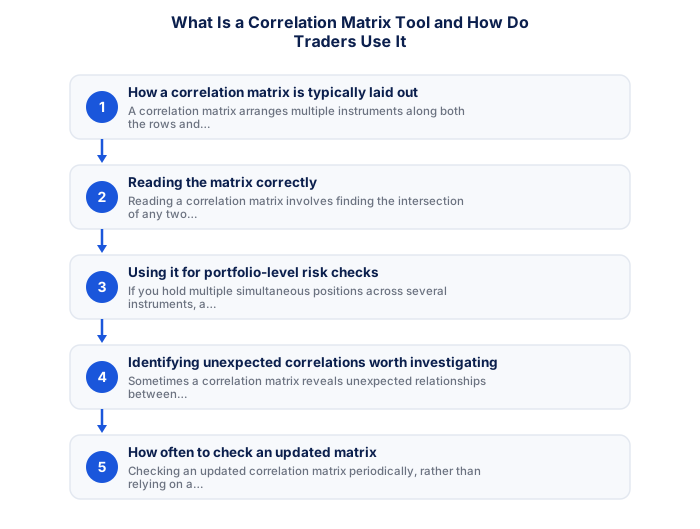
1. How a correlation matrix is typically laid out
A correlation matrix arranges multiple instruments along both the rows and columns of a grid, with each cell showing the correlation coefficient between that specific row instrument and column instrument. This grid format lets you see correlation relationships across many instrument pairs simultaneously, rather than checking pairs one at a time individually.
2. Reading the matrix correctly
Reading a correlation matrix involves finding the intersection of any two specific instruments you're interested in, with the resulting cell value following the same interpretation, closer to +1 indicating strong positive correlation, closer to -1 indicating strong negative correlation, and values near zero indicating little meaningful relationship between that specific pair of instruments.
- Two-factor authentication enabled
- Unique password not shared with other sites
- Broker mobile app installed and tested
- Mobile data backup connection tested
- Price alerts set for active instruments
- Broker emergency number saved in phone
- Know how to close all positions in under 30 seconds
- Desktop: full charting, multi-monitor, all order types
- Mobile: real-time monitoring and load shedding backup
- Mobile: price alerts when away from desk
- Desktop: useless during load shedding without UPS
- Mobile: limited charting for detailed analysis
- Mobile: higher risk of fat-finger errors
- Full charting and analysis
- Best for trade entry
- Multi-monitor support
- More order types available
- Monitor and manage on the go
- Load shedding backup use
- Push price alerts
- Limited charting tools
3. Using it for portfolio-level risk checks
If you hold multiple simultaneous positions across several instruments, a correlation matrix lets you quickly check whether your overall combined exposure is genuinely diversified or unintentionally concentrated, by scanning across all the relevant intersections for your specific currently-held instruments simultaneously, rather than checking each pair combination individually and manually compiling the results yourself.
| Feature | MT4 | MT5 |
|---|---|---|
| Broker availability | Very wide | Growing |
| EA library | Largest available | Smaller but growing |
| Timeframes | 9 built-in | 21 built-in |
| Asset classes | Forex and CFDs | Forex, CFDs, stocks |
| Mobile app | Good | More modern UI |
4. Identifying unexpected correlations worth investigating
Sometimes a correlation matrix reveals unexpected relationships between instruments that might not seem obviously connected at first glance, prompting further investigation into what underlying fundamental factor might be driving this less intuitive correlation. This kind of discovery can sometimes reveal genuinely useful additional analytical insight beyond what the more commonly discussed, intuitive correlation relationships might suggest.
5. How often to check an updated matrix
Checking an updated correlation matrix periodically, rather than relying on a single historical snapshot indefinitely, ensures your diversification and risk assessment reflects genuinely current relationships, particularly important if you maintain longer-term, multiple simultaneous positions across an extended period during which underlying correlations might shift.
Choosing a trading platform involves balancing familiarity, charting capability, execution reliability, and the availability of features relevant to your specific strategy. South African traders should also verify that their platform of choice remains accessible during load shedding through mobile apps and that it supports the instruments and order types they need. Testing your platform thoroughly on a demo account before relying on it for live trading identifies any usability issues before they cost real money.
6. Where to find this tool in practice
Many charting platforms, financial data websites, and some broker platforms, include built-in correlation matrix functionality, typically updated regularly using recent historical price data, removing the need to calculate this grid manually across many instrument pairs yourself.
The practical reliability of trading technology matters more in South Africa than in most developed market trading environments, given load shedding's potential to interrupt connectivity at any point during a trading session. South African traders should test their complete backup connectivity solution, typically mobile data hotspot on 4G/LTE, specifically with their trading platform before relying on it during a real load shedding event. Knowing that your mobile backup actually connects to your broker and allows order management is a five-minute test that could prevent a significant connectivity-related loss.
Every South African trader who approaches the market with a structured plan, clear risk parameters, and disciplined execution starts each session from a position of strength that the majority of retail participants, who operate reactively and without documented rules, do not have. Building and maintaining this structural advantage requires consistent effort rather than exceptional talent, which means it is accessible to any trader willing to invest the time in proper preparation and honest self-assessment.
A correlation matrix helps spot when two positions are likely to move together, doubling effective risk, and helps find pairs or instruments with different exposure.
★ Why It Matters
Something worth checking specifically: correlation figures shown on these tools are typically calculated over a trailing period like 20 or 50 days, and can shift meaningfully between calmer and more volatile market regimes, a correlation reading from six months ago isn't necessarily still accurate today.
✕ Common mistakes
- Using an outdated correlation figure for current trading decisions. A reading from months ago isn't necessarily still accurate today.
- Assuming correlation between two instruments never changes direction. Correlations can shift, and occasionally invert, during periods of market stress.
- Not recalculating correlation periodically for actively traded pairs. Regular updates keep this input useful.
Analytical tools and frameworks add value only to the extent that they improve your actual trading decisions rather than providing reassurance or filling time between trades. The most effective approach to adopting new analytical tools is to paper-trade with them for a defined period, comparing outcomes against your results without the tool, before integrating them into your live trading process. South African traders should additionally assess whether any tool they consider incorporates SA-specific data sources, particularly SARB data, JSE specific feeds, and local economic calendar data, since global tools default to non-ZAR market data that may not fully capture the drivers relevant to their primary instruments.
Key Takeaways
- A correlation matrix displays current correlation coefficients across many instrument pairs simultaneously, supporting quick diversification and risk checks.
- A correlation matrix displays current correlation coefficients across many instrument pairs simultaneously, in a single grid.
- This supports quick diversification checks and risk assessment across an entire multi-instrument portfolio at once.
- How a correlation matrix is typically laid out.
- Reading the matrix correctly.
Frequently asked follow-up questions
Is a correlation matrix only useful for forex pairs?
No, correlation matrices can include any combination of instruments, including currencies, commodities, and indices together in the same grid.
Do I need this tool if I only trade one instrument?
Less critically useful if trading only a single instrument, since correlation specifically concerns relationships between multiple instruments; it becomes more relevant once you hold or consider multiple simultaneous positions.
Are correlation matrices free to access?
Many are freely available through trading platforms and financial data websites, though some more specialised or frequently-updated versions may require a paid subscription.
