i Short answer
Losing streaks are statistically normal, occurring even within genuinely sound strategies with a real edge over a large enough sample of trades.
The key skill is distinguishing normal statistical variance from genuine strategy failure, rather than reacting emotionally and abandoning a sound approach.
📋 ON THIS PAGE
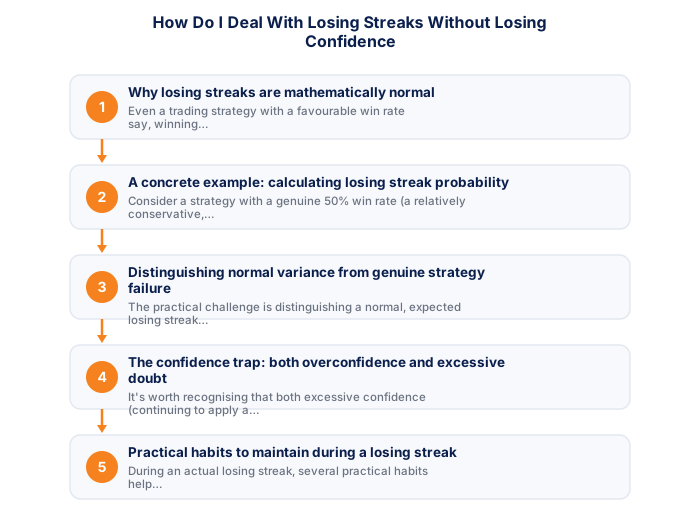
- Why losing streaks are mathematically normal
- A concrete example: calculating losing streak probability
- Distinguishing normal variance from genuine strategy failure
- The confidence trap: both overconfidence and excessive doubt
- Practical habits to maintain during a losing streak
- When genuine concern about a strategy actually is warranted
1. Why losing streaks are mathematically normal
Even a trading strategy with a genuinely favourable win rate, say, winning 55% of trades, will, simply through normal statistical variance, periodically produce consecutive losing streaks purely by chance, in the same way a coin with a slight bias toward heads will still occasionally produce several tails in a row over a large enough number of flips. This is a basic, unavoidable mathematical property of any strategy that doesn't win 100% of the time (which essentially no genuine trading strategy does, or realistically could).
Understanding this mathematical reality clearly is genuinely important: a string of losing trades, by itself, doesn't constitute evidence that a strategy has stopped working or was never sound in the first place, it may simply reflect entirely normal, statistically expected variance that any strategy with a less-than-100%-but-still, favourable win rate will periodically produce.
It's worth internalising this mathematically, not just intellectually accepting it once and moving on, actually running or reviewing the probability calculation for your own specific strategy's win rate gives you a concrete, personal reference point to return to during an actual losing streak, rather than relying on a general principle that feels less convincing under real emotional pressure.
2. A concrete example: calculating losing streak probability
Consider a strategy with a genuine 50% win rate (a relatively conservative, illustrative example). The probability of experiencing at least one losing streak of five consecutive trades within a reasonably sized sample of, say, 100 total trades is actually fairly high, well above what most traders' intuition would suggest, since human intuition about randomness and streak probability tends to be systematically unreliable, generally underestimating how often streaks of a given length naturally occur even in genuinely random, fair processes.
This concrete illustration is worth holding onto specifically because it helps counteract the common but mistaken intuitive reaction many traders have upon experiencing a losing streak, assuming that several consecutive losses must indicate something has gone wrong, rather than recognising this as an entirely expected, normal statistical occurrence that a sound strategy with a reasonable, even modest, win rate will periodically and predictably produce.
- FSCA-regulated broker verified at fsca.co.za
- Demo account tested for minimum 60 days
- Trading plan written: entry, exits, position sizing
- Risk per trade defined (1-2% of account)
- Backup internet connection tested for load shedding
- Tax implications understood
It's worth running this same calculation using your own strategy's actual backtested or forward-tested win rate, rather than the illustrative 50% figure here, seeing your own specific numbers makes the statistical reality considerably more personally relevant than a generic example ever could be.
3. Distinguishing normal variance from genuine strategy failure
The practical challenge is distinguishing a normal, expected losing streak (which a fundamentally sound strategy will eventually recover from, given a sufficient subsequent sample of trades) from genuine strategy failure (where the underlying market conditions or dynamics the strategy was designed around have genuinely changed in a way that's eroded whatever edge the strategy previously had). This distinction requires a sufficiently large sample size to evaluate reliably, a handful of losing trades alone simply doesn't provide enough statistical evidence to distinguish between these two genuinely different scenarios with any real confidence.
A useful practical approach involves predetermining, in a calm planning moment well before any losing streak actually occurs, what specific evidence (a defined number of trades, or a specific cumulative drawdown threshold) would justify pausing to reassess or adjust a strategy, rather than making this critical judgement reactively in the immediate emotional aftermath of any specific losing streak, when sound, objective judgement is hardest to maintain reliably.
It's worth writing this threshold down explicitly, in the same document as your broader trading plan, rather than trying to define it in the moment a losing streak is actually underway, a predetermined, written threshold protects you from redefining 'acceptable' downward simply to justify continuing, or upward simply to justify quitting, based on how you happen to feel in that moment.
4. The confidence trap: both overconfidence and excessive doubt
It's worth recognising that both excessive confidence (continuing to apply a genuinely flawed strategy indefinitely, dismissing mounting evidence of genuine failure as "just variance") and excessive doubt (abandoning a sound strategy after a normal, statistically expected losing streak that doesn't actually indicate anything has gone wrong) represent genuine psychological traps, and the appropriate, balanced response sits specifically between these two extremes rather than favouring either blind persistence or premature abandonment as a generally "safer" default response.
managing between these two traps reliably requires the kind of objective, sample-size-based evaluation discussed above, rather than relying on gut feeling or emotional state alone to determine the right response, emotional state during a losing streak is, almost by definition, not a reliable guide to objective strategy evaluation, precisely because the emotional discomfort of recent losses naturally biases judgement in one direction or the other depending on individual psychological tendencies.
| Item | Detail |
|---|---|
| Regulator | FSCA, fsca.co.za |
| Exchange control | SARB, resbank.co.za |
| Tax authority | SARS, sars.gov.za |
| JSE hours | 09:00-17:00 SAST Mon-Fri |
| Best forex session | 15:00-17:00 SAST |
| CGT annual exclusion | R50,000 (individuals) |
It's worth checking in with yourself honestly about which of these two traps you personally tend toward, since most traders lean noticeably more one direction than the other, knowing your own tendency helps you specifically guard against your particular blind spot rather than treating both risks as equally likely for you.
5. Practical habits to maintain during a losing streak
During an actual losing streak, several practical habits genuinely help maintain appropriate perspective and discipline: reviewing your trading journal specifically to confirm whether your strategy's rules were actually followed correctly and consistently during the losing trades (distinguishing strategy-driven losses from execution errors, which are different problems requiring different responses), calculating where the current losing streak actually falls within your strategy's previously backtested or forward-tested range of normal statistical variance, and maintaining your predetermined position sizing and risk management rules without deviation, resisting any temptation to either increase position size position size (in an attempt to recover losses more quickly) or abandon the strategy prematurely before it's had a fair, statistically meaningful chance to recover.
Talking through a losing streak with a trusted, experienced trading peer or mentor, if available, can also provide valuable outside perspective when your own emotional proximity to the situation makes objective self-assessment difficult to maintain reliably on your own.
6. When genuine concern about a strategy actually is warranted
Genuine concern about a strategy's continued viability becomes warranted when a losing streak's length or severity meaningfully exceeds what your strategy's own prior backtesting or forward-testing data suggested was statistically normal, when you can identify a specific, genuine change in underlying market conditions that plausibly explains why a previously effective strategy might no longer be well-suited to current conditions, or when careful trading journal review reveals the losses stem from consistent execution errors or rule deviations rather than the strategy's underlying logic itself being sound but simply experiencing normal variance.
In these genuinely warranted cases, the appropriate response involves a deliberate, calm strategy review process, potentially returning to additional demo testing or backtesting to reassess viability, rather than either stubbornly continuing unchanged or abandoning trading altogether in frustration, since a measured, evidence-based response serves you better than either extreme reaction in ambiguous situations.
Even a strategy with a favourable win rate will produce losing streaks. Calculating the expected probability of a given streak length helps distinguish normal variance from a genuine concern.
★ Why It Matters
A concrete check we'd suggest: calculate the probability of your specific losing streak length occurring given your strategy's actual historical win rate, a 5-trade losing streak is mathematically unremarkable for a strategy with a 45% win rate, but feels catastrophic in the moment regardless.
✕ Common mistakes
- Reacting emotionally before checking if the streak is statistically normal. Many losing streaks fall within a sound strategy's expected range.
- Abandoning a strategy after a short losing stretch. A small sample rarely justifies a major strategy change.
- Increasing position size to recover losses faster. This compounds risk exactly when discipline matters most.
- Not calculating the probability of your specific streak length. This calculation often shows the streak is less unusual than it feels.
Is this a mindset problem or a method problem?
Test it this way: if the plan was followed and the result was still poor, the method is wrong. If the plan was sound and got abandoned, it is not. Telling the two apart covers it in full.
Is it normal to feel anxious about this?
Some is ordinary and some is a signal the position is too large for your tolerance. Fear before entry covers where the line sits.
Key Takeaways
- Losing streaks are statistically normal even for sound strategies. Learn how to distinguish normal variance from genuine strategy failure.
- Losing streaks are statistically normal, occurring even within genuinely sound strategies with a real edge over a large enough sample of trades.
- The key skill is distinguishing normal statistical variance from genuine strategy failure, rather than reacting emotionally and abandoning a sound approach.
- Why losing streaks are mathematically normal.
- A concrete example: calculating losing streak probability.
Frequently asked follow-up questions
How many consecutive losses should make me worried?
There's no universal number; what matters is whether the streak's length and severity exceeds what your specific strategy's prior testing data suggested was statistically normal for its actual win rate and risk-reward profile.
Should I reduce my position size during a losing streak?
Some traders do reduce position size temporarily during losing streaks as an additional psychological and risk-management safeguard, though this should be a predetermined rule decided in advance rather than a reactive, in-the-moment decision.
Does experience make losing streaks easier to handle emotionally?
Many traders report that accumulated experience and a track record of strategies eventually recovering from normal losing streaks does build genuine emotional resilience over time, though this typically develops gradually rather than immediately.
