i Short answer
Some day traders specifically trade the reversal that follows a failed breakout, treating the fakeout itself as a tradeable signal in the opposite direction.
📋 ON THIS PAGE
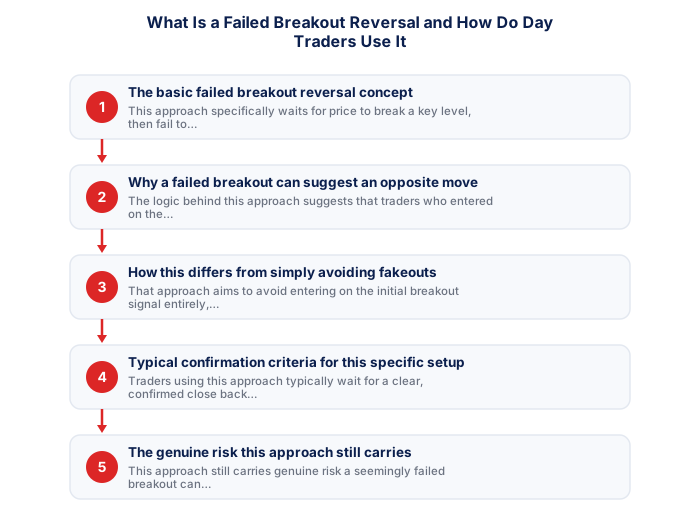
1. The basic failed breakout reversal concept
This approach specifically waits for price to break a key level, then fail to sustain that breakout and reverse back through the original level, treating this specific reversal pattern as a tradeable signal in the opposite direction, rather than simply something to have avoided entering on initially.
2. Why a failed breakout can suggest an opposite move
The logic behind this approach suggests that traders who entered on the initial, ultimately failed breakout may now be trapped in a losing position, potentially needing to exit, which can itself contribute additional pressure reinforcing the subsequent reversal move in the opposite direction.
- FSCA-regulated broker verified at fsca.co.za
- Demo account tested for minimum 60 days
- Trading plan written: entry, exits, position sizing
- Risk per trade defined (1-2% of account)
- Backup internet connection tested for load shedding
- Tax implications understood
3. How this differs from simply avoiding fakeouts
Avoiding a false breakout aims to prevent entering on the initial breakout signal entirely, while this reversal-trading approach instead specifically waits for and trades the failure itself, treating it as the actual primary signal rather than simply a risk to filter out.
4. Typical confirmation criteria for this specific setup
Traders using this approach typically wait for a clear, confirmed candle close back through the original breakout level, sometimes combined with volume or momentum confirmation, before entering the reversal trade with appropriate, predetermined risk management.
| Item | Detail |
|---|---|
| Regulator | FSCA, fsca.co.za |
| Exchange control | SARB, resbank.co.za |
| Tax authority | SARS, sars.gov.za |
| JSE hours | 09:00-17:00 SAST Mon-Fri |
| Best forex session | 15:00-17:00 SAST |
| CGT annual exclusion | R50,000 (individuals) |
5. The genuine risk this approach still carries
This approach still carries genuine risk given trading's inherent uncertainty. A seemingly failed breakout can sometimes resume in the original direction after a brief pullback, meaning this isn't a guaranteed pattern despite its logical underlying reasoning.
6. Testing this approach before trading it live
Backtesting this specific approach against historical data for your particular instruments and timeframes before committing real capital confirms whether this pattern genuinely produces a statistical edge in your specific trading context.
South African hours put the deepest liquidity in the late afternoon, during the overlap. liquidity
A failed breakout reverses sharply, trapping breakout buyers or sellers.
A genuine breakout continues in the breakout direction with volume support. A failed breakout reversal sees price quickly snap back, trapping those who entered on the initial break.
Advanced technical analysis methods produce their most reliable signals when applied in instruments and timeframes where they were originally developed and validated. USD/ZAR's sensitivity to fundamental events means that technical patterns on this pair are more frequently invalidated by fundamental catalysts than equivalent patterns on major USD pairs like EUR/USD or GBP/USD. South African traders applying complex technical methods to ZAR instruments should weight fundamental context, particularly the SARB MPC calendar, budget speech timing, and credit rating review dates, as a filter that can override technical signals when high-impact fundamental events are imminent.
★ Why It Matters
Worth backtesting if this interests you: how often a failed breakout at a given level is followed by a genuine reversal versus just choppy, directionless price. This ratio varies considerably by instrument and is worth knowing for your specific traded markets before relying on it.
✕ Common mistakes
- Trading this pattern without backtesting it for your specific instrument. Reliability varies considerably between markets and is worth verifying directly.
- Treating every failed breakout as a guaranteed reversal signal. Some simply lead to continued choppy, directionless price.
- Not using a stop-loss disciplined enough for this counter-trend approach. This technique inherently fights the immediate prior move.
- Assuming the pattern works identically across all timeframes. Reliability can differ meaningfully depending on chart timeframe.
Key Takeaways
- Some day traders specifically trade the reversal following a failed breakout, treating the fakeout itself as a tradeable signal rather than simply a risk.
- Some day traders specifically trade the reversal that follows a failed breakout, treating the fakeout itself as a tradeable signal in the opposite direction.
- The basic failed breakout reversal concept.
- Why a failed breakout can suggest an opposite move.
- How this differs from simply avoiding fakeouts.
Frequently asked follow-up questions
Is this approach suitable for beginners?
Given the genuine pattern-recognition skill and confirmation discipline this requires, this is generally better suited to traders with some existing breakout-trading experience first.
Does this work better on certain instruments than others?
This depends on your own specific backtesting, since pattern reliability can vary by instrument's specific volatility and typical trading behaviour.
How do I distinguish a genuine failed breakout from just normal price fluctuation?
Using clear, predetermined confirmation criteria, like candle close and volume confirmation, helps distinguish a genuinely meaningful failure from routine, minor price noise.
Can this approach be combined with a false breakout filter?
Yes, some traders use filtering to avoid the initial breakout entry while separately watching for and trading the failure pattern as a distinct, separate opportunity.
Does this strategy require a different stop-loss approach than standard breakout trading?
Stop-loss placement should reflect this specific setup's own logic, typically placed beyond the point that would invalidate the reversal thesis specifically, rather than simply copying standard breakout stop placement.
