i Short answer
Martingale doubles position size after each loss, aiming to recover all previous losses with a single eventual win.
This is genuinely dangerous, as it can rapidly deplete an account during a losing streak despite its surface-level appeal.
📋 ON THIS PAGE
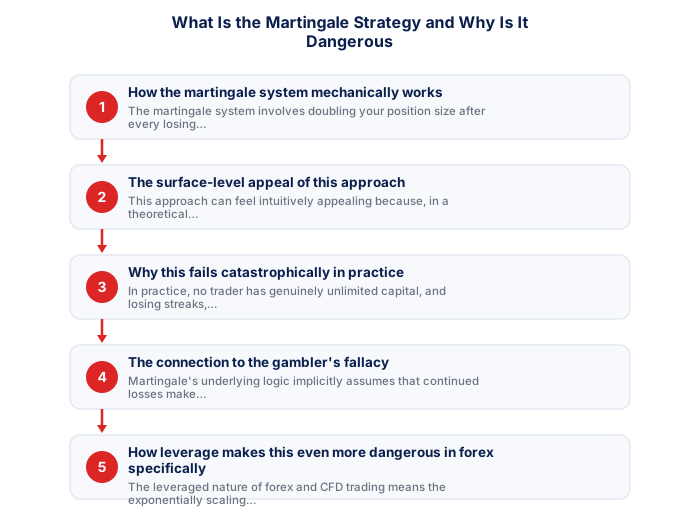
1. How the martingale system mechanically works
The martingale system involves doubling your position size after every losing trade, with the theory that the next winning trade, whenever it eventually occurs, will recover all accumulated previous losses plus generate the originally intended profit, since the doubled size compensates exactly for the prior loss.
It's worth tracing through this mechanic concretely to appreciate how quickly it escalates, since each doubling compounds on the previous one, a modest starting position size can grow to an enormous, account-threatening size after only a handful of consecutive losses.
See also: What Is the Gambler's Fallacy in Trading?
See also: Can I Trade Forex as a South African Living Abroad?
See also: What Is a Trading Strategy Walk-Forward Test?
See also: How Does Trading the VIX or Volatility Index Products Wor
2. The surface-level appeal of this approach
This approach can feel intuitively appealing because, in a theoretical scenario with unlimited capital and no position size constraints, a single eventual win would indeed recover all prior losses, this mathematical property is genuinely true in isolation, which is precisely why the approach can seem deceptively sound before considering its real-world practical limitations.
It's worth recognising exactly why this appeal is deceptive, discussed elsewhere on this site regarding the gambler's fallacy specifically, the reasoning assumes a losing streak somehow makes an eventual win more likely or imminent, a genuine misunderstanding of how independent, random events actually work.
- Quantifiable rules remove subjectivity
- Backtestable on historical data
- Works consistently when edge is genuine
- Clear entry/exit criteria reduce hesitation
- Past performance does not guarantee future results
- Risk of overfitting to historical data
- Market regimes change, edges decay
- Requires discipline through drawdown periods
- Price and volume patterns
- Works on any liquid instrument
- Faster to learn basics
- Ignores fundamental context
- Economic and financial data
- Better for longer timeframes
- Deeper knowledge required
- Ignores entry precision
3. Why this fails catastrophically in practice
In practice, no trader has genuinely unlimited capital, and losing streaks, a normal part of statistical variance, can extend longer than seems intuitively likely, a string of just seven or eight consecutive losses, while statistically possible even for a sound strategy, would require an exponentially scaling position size that quickly exceeds any realistic account size, often resulting in complete account depletion before the theoretical recovery trade ever occurs.
It's worth understanding why this failure is essentially inevitable given enough time, discussed elsewhere on this site regarding risk of ruin specifically, every trader eventually encounters a losing streak long enough to either exhaust their available capital or exceed their account's maximum position size limits.
- Written entry/exit rules with zero ambiguity
- Backtested on minimum 3 years of data
- Walk-forward tested on out-of-sample data
- SA-specific events included in test period
- Maximum drawdown within personal tolerance
- 100+ live demo trades with consistent performance
4. The connection to the gambler's fallacy
Martingale's underlying logic implicitly assumes that continued losses make an eventual win more statistically likely or somehow "due," when in reality, for most independent trading setups, each trade's probability of success remains unchanged regardless of how many previous trades have lost.
It's worth appreciating that martingale represents this fallacy translated directly into an actual, executable trading system, rather than simply a flawed belief, worth understanding this connection as illustrating exactly how dangerous acting on this specific reasoning error can become when systematised.
| Win rate | 1:1 RR | 1.5:1 RR | 2:1 RR |
|---|---|---|---|
| 40% | Losing | Break even | Profitable |
| 50% | Break even | Profitable | Profitable |
| 55% | Profitable | Profitable | Profitable |
| 60% | Profitable | Profitable | Profitable |
5. How leverage makes this even more dangerous in forex specifically
The leveraged nature of forex and CFD trading means the exponentially scaling position sizes martingale requires consume margin at an accelerating rate, often triggering a margin call or stop-out well before the theoretical recovery trade has any opportunity to occur.
It's worth appreciating why this combination is particularly severe, discussed throughout this site regarding leverage generally, the exponential position growth this strategy demands combines with leverage's own amplification effect to accelerate account depletion considerably faster than the same approach applied without leverage.
6. Why disciplined position sizing is the genuine alternative
Maintaining consistent, modest position sizing regardless of recent results, in line with a disciplined risk-per-trade rule, represents the genuine, sustainable alternative to martingale's appealing but fundamentally flawed logic, protecting your account from the catastrophic depletion risk this approach genuinely carries.
Martingale doubles the position after every loss, creating exponential growth in position size. Six consecutive losses from a R100 starting trade reach R6,400. One extended losing streak can wipe far more than all prior gains combined.
★ Why It Matters
Worth calculating directly: the position size required after just 6-7 consecutive losses under a doubling approach starting from a modest base. The number grows so quickly that most traders are genuinely shocked the first time they actually do this calculation rather than just hearing the strategy described.
✕ Common mistakes
- Assuming an eventual win will always arrive before capital runs out. A long enough losing streak can exhaust even substantial capital.
- Treating Martingale's surface-level logic as sound without examining the downside scenario. The theoretical appeal hides a real, severe practical risk.
- Combining Martingale-style sizing with already elevated leverage. This compounds two high-risk elements simultaneously.
Key Takeaways
- Martingale doubles position size after each loss, a genuinely dangerous approach that can rapidly deplete an account during a losing streak despite intuitive appeal.
- Martingale doubles position size after each loss, aiming to recover all previous losses with a single eventual win.
- This is genuinely dangerous, as it can rapidly deplete an account during a losing streak despite its surface-level appeal.
- How the martingale system mechanically works.
- The surface-level appeal of this approach.
Frequently asked follow-up questions
Has martingale ever worked for any trader long-term?
Some traders may experience short-term apparent success before an eventually extended losing streak produces catastrophic loss, making any apparent short-term success misleading about genuine long-term viability.
Are there less extreme versions of martingale that are safer?
Some variations exist with more modest scaling factors, though these still carry the same fundamental structural risk, simply at a somewhat slower rate of capital depletion.
Why do some traders still use martingale despite these risks?
The approach's surface-level mathematical appeal and the genuine but misleading short-term success it can produce continues attracting some traders despite its fundamentally flawed long-term logic.
