i Short answer
Candlestick patterns are visual chart formations summarising price action over a specific period, making certain recurring patterns easier to identify than on simple line charts.
Some patterns show modest, though inconsistent, statistical edge, and generally work best combined with other analysis rather than relied on alone.
📋 ON THIS PAGE
- How a single candlestick is actually constructed
- Common patterns worth knowing about
- The honest research evidence behind pattern effectiveness
- Why surrounding context matters more than the pattern alone
- Combining candlestick patterns with support and resistance
- A balanced, evidence-aware approach to using these patterns
1. How a single candlestick is actually constructed
Each individual candlestick represents price action over a chosen time period (a single day, hour, or minute, depending on your selected chart timeframe), displaying the opening price, closing price, and the highest and lowest prices reached during that period. The "body" of the candle represents the range between open and close, typically shown in different colours (or shading) depending on whether the period closed higher or lower than it opened, while thin lines called "wicks" or "shadows" extend to show the full high-low range beyond the body itself.
This visual format packs considerably more information into a single chart element than a simple line connecting closing prices alone would provide, which is exactly why candlestick charts have become a standard, widely-used format across technical analysis.
Learning to read this at a glance, rather than consciously working through open, close, high, and low each time, takes some deliberate practice early on. It's worth spending time simply looking at candles on a chart and naming what each element represents out loud or in your own notes, until interpreting the shape becomes automatic rather than a mental translation exercise every time you look at a chart.
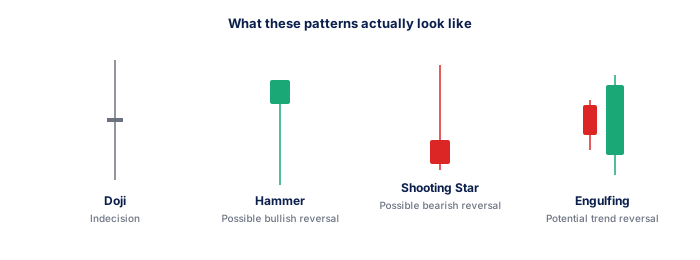
| Pattern | General Signal |
|---|---|
| Doji | Indecision |
| Hammer | Potential bullish reversal |
| Shooting Star | Potential bearish reversal |
| Engulfing | Potential trend reversal |
2. Common patterns worth knowing about
Among the most commonly discussed candlestick patterns are the "doji" (where open and close are very close together, suggesting genuine indecision between buyers and sellers during that period), "engulfing" patterns (where one candle's body completely covers the previous candle's body, sometimes interpreted as a potential reversal signal), and "hammer" or "shooting star" patterns (showing a long wick in one direction with a small body, sometimes interpreted as rejection of price movement in that wick's direction).
These represent just a sample of the many named patterns discussed across trading education resources. Rather than attempting to memorise an exhaustive list of every named pattern, many traders find genuine value in deeply understanding a small handful of the most well-evidenced, commonly recognised patterns rather than superficially knowing many without genuine depth of understanding.
- Quantifiable rules remove subjectivity
- Backtestable on historical data
- Works consistently when edge is genuine
- Clear entry/exit criteria reduce hesitation
- Past performance does not guarantee future results
- Risk of overfitting to historical data
- Market regimes change, edges decay
- Requires discipline through drawdown periods
- Price and volume patterns
- Works on any liquid instrument
- Faster to learn basics
- Ignores fundamental context
- Economic and financial data
- Better for longer timeframes
- Deeper knowledge required
- Ignores entry precision
This depth-over-breadth approach has a practical benefit beyond simply being easier to learn: genuinely understanding why a pattern like a doji reflects indecision, rather than just recognising its shape, makes it easier to correctly judge when a real-world candle that doesn't perfectly match the textbook diagram still carries similar meaning, something that pure shape-memorisation doesn't easily support.
3. The honest research evidence behind pattern effectiveness
Academic and quantitative research into candlestick pattern effectiveness has produced genuinely mixed results, broadly consistent with the mixed evidence around technical analysis generally. Some specific patterns show modest, statistically detectable edge in certain studies and market conditions, while other studies find limited support for many commonly discussed patterns once rigorous statistical testing is applied across large, varied datasets.
This honest, mixed evidence picture is worth holding clearly in mind rather than either dismissing candlestick patterns entirely as worthless, or treating them as a reliably proven, mechanical predictive tool. The genuine picture sits somewhere between these two extremes, warranting personal, rigorous testing of your own specific approach against your own actual results.
- Written entry/exit rules with zero ambiguity
- Backtested on minimum 3 years of data
- Walk-forward tested on out-of-sample data
- SA-specific events included in test period
- Maximum drawdown within personal tolerance
- 100+ live demo trades with consistent performance
It's worth applying the same scepticism here that's appropriate for technical analysis generally: a pattern that appears to work well in a specific study covering one market and time period doesn't automatically transfer with identical reliability to a different instrument, timeframe, or market condition, which is exactly why testing a pattern against your own specific trading context matters more than trusting a general claim about its effectiveness.
4. Why surrounding context matters more than the pattern alone
A specific candlestick pattern's reliability appears to depend considerably on its surrounding context. The same pattern occurring at a significant support or resistance level, or after a sustained prior trend, may carry meaningfully different significance than the identical pattern occurring in an otherwise unremarkable, range-bound section of the chart without this broader supporting context.
This context-dependency helps explain why simply memorising pattern shapes without understanding the broader market structure and context surrounding them tends to produce considerably less reliable results than integrating pattern recognition within a more complete analytical framework that considers this broader surrounding context explicitly.
| Win rate | 1:1 RR | 1.5:1 RR | 2:1 RR |
|---|---|---|---|
| 40% | Losing | Break even | Profitable |
| 50% | Break even | Profitable | Profitable |
| 55% | Profitable | Profitable | Profitable |
| 60% | Profitable | Profitable | Profitable |
This is worth demonstrating to yourself directly: pull up several historical instances of the identical pattern on a chart you know well, and compare how price actually behaved afterward in each case. You'll likely find the pattern's apparent reliability varies noticeably depending on what was happening around it, direct, personal evidence that context genuinely matters rather than an abstract claim to simply accept.
5. Combining candlestick patterns with support and resistance
Many traders specifically look for candlestick patterns occurring at previously identified support or resistance levels, treating the combination of a recognised pattern at a significant level as giving more meaningful confirmation than either signal alone would. A bullish reversal pattern occurring precisely at a well-established support level, for example, is generally considered more significant than the identical pattern occurring at an arbitrary, unremarkable price point.
This combination approach reflects the broader principle of combining multiple analytical signals thoughtfully. Candlestick patterns work best as one input within a broader analytical framework, rather than as an isolated, standalone signal disconnected from this broader supporting context.
This combination is a natural extension of the confluence principle that runs through sound technical analysis generally, looking for multiple independent signals pointing the same direction before treating a setup as genuinely compelling, rather than acting on any single signal, however visually striking, in isolation from everything else the chart is showing.
6. A balanced, evidence-aware approach to using these patterns
A balanced, evidence-aware approach to candlestick patterns involves learning a focused set of well-documented patterns thoroughly, testing your own application of these patterns through backtesting and forward-testing, and treating any individual pattern as one input among several within your broader strategy rather than a standalone, sufficient trading signal in isolation.
This measured approach avoids both the common beginner mistake of treating pattern recognition as a kind of mechanical, guaranteed signal system, and the opposite mistake of dismissing this widely-used analytical tool entirely without giving it the same rigorous, personal evaluation appropriate for any technical analysis technique.
The approach matters less than the basis: measure against real price behaviour rather than convenience. volatility
Most patterns require additional confirmation to produce reliable outcomes.
Candlestick patterns work more reliably as context clues alongside other analysis than as standalone signals. Most require additional confirmation, particularly at meaningful support or resistance levels.
★ Why It Matters
Worth checking for yourself: backtest a single specific candlestick pattern you currently rely on against your own chosen instrument and timeframe, rather than trusting a generic, often US-equity-derived statistic. Pattern reliability appears to vary meaningfully across different instruments and timeframes.
✕ Common mistakes
- Relying on a single candlestick pattern in isolation. These tend to work better combined with other confirming analysis.
- Assuming pattern reliability is identical across all timeframes. The same pattern can behave differently depending on chart timeframe.
- Not backtesting a pattern before trading it with real capital. See backtesting as the step that separates genuine reliability from assumption.
Key Takeaways
- Candlestick patterns visually summarise price action over a period, with some patterns showing modest statistical edge. Learn the honest evidence behind them.
- Candlestick patterns are visual chart formations summarising price action over a specific period, making certain recurring patterns easier to identify than on simple line charts.
- Some patterns show modest, though inconsistent, statistical edge, and generally work best combined with other analysis rather than relied on alone.
- How a single candlestick is actually constructed.
- Common patterns worth knowing about.
See also: Which Technical Indicators Do South African Traders Rely On?.
Frequently asked follow-up questions
Should I memorise dozens of different candlestick pattern names?
Many experienced traders suggest deeply understanding a small handful of well-evidenced patterns is more valuable than superficially knowing many pattern names without genuine depth of application.
Do candlestick patterns work the same way across all instruments?
The underlying visual patterns are universal, but their statistical reliability can vary by instrument given differences in typical volatility and trading behaviour.
Can I trade based on a single candlestick pattern alone without other confirmation?
This is generally not recommended given the mixed evidence and context-dependency above. Combining patterns with other analysis tends to produce more reliable results.
