i Short answer
Divergence occurs when price and a momentum indicator like RSI move in opposite directions, sometimes signalling weakening momentum and a potential reversal.
This works best combined with other confirming analysis rather than relied upon in isolation.
📋 ON THIS PAGE
- Bullish divergence explained, with an example
- Bearish divergence explained, with an example
- Why divergence can signal weakening underlying momentum
- The genuine limitations of this signal worth understanding
- Combining divergence with support and resistance
- A balanced approach to using divergence in your own analysis
1. Bullish divergence explained, with an example
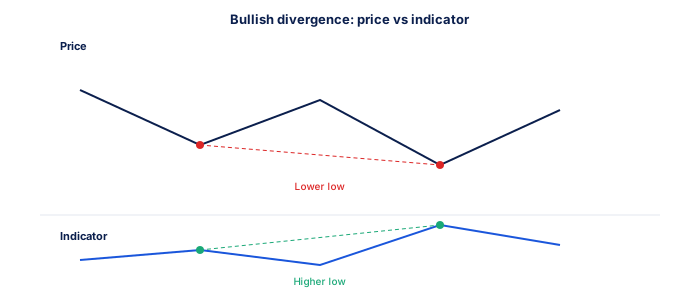
Bullish divergence occurs when price makes a new lower low, but a momentum indicator like RSI fails to make a correspondingly lower low, instead showing a higher low, suggesting that despite price continuing to fall, the underlying selling momentum driving this decline may be weakening, sometimes interpreted as an early warning that a downtrend could be approaching exhaustion.
It's worth practising spotting this pattern deliberately on historical charts before relying on it live, discussed elsewhere on this site regarding chart practice generally, comparing price lows against corresponding indicator lows repeatedly builds the pattern recognition needed to spot this reliably in real time.
| Feature | Bullish Divergence | Bearish Divergence |
|---|---|---|
| Price makes | Lower low | Higher high |
| Indicator makes | Higher low | Lower high |
| Suggests | Weakening downward momentum | Weakening upward momentum |
2. Bearish divergence explained, with an example
Bearish divergence works in the opposite direction, price makes a new higher high, but the momentum indicator fails to confirm this with a correspondingly higher high, instead showing a lower high, suggesting weakening underlying buying momentum despite the continued price advance, sometimes interpreted as an early warning of a potential upcoming reversal from an uptrend.
It's worth noticing this pattern requires comparing two separate highs, not just observing a single high in isolation, the divergence specifically emerges from this comparison between price behaviour and indicator behaviour across at least two comparable points.
- FSCA-regulated broker verified at fsca.co.za
- Demo account tested for minimum 60 days
- Trading plan written: entry, exits, position sizing
- Risk per trade defined (1-2% of account)
- Backup internet connection tested for load shedding
- Tax implications understood
3. Why divergence can signal weakening underlying momentum
The logic underlying divergence is that momentum indicators measure the rate or strength of price change, not simply price direction itself. When price continues advancing or declining but the rate of that movement is genuinely slowing, even while the absolute price level continues moving in the same direction, this can suggest the underlying conviction behind the move is fading.
It's worth understanding the underlying logic here concretely, momentum indicators measure the rate of price change, not just direction, when price continues climbing but the rate of that climb is genuinely slowing, the indicator reflects this weakening even while price itself hasn't yet reversed.
4. The genuine limitations of this signal worth understanding
Divergence can persist for extended periods without producing an actual reversal, and price can continue moving in its established direction for a considerable time despite showing divergence, making this signal genuinely unreliable as a standalone, precisely-timed entry trigger, consistent with the broader mixed evidence around technical analysis signals generally.
It's worth backtesting divergence specifically for your own traded instruments before relying on it as a primary signal, discussed elsewhere on this site regarding backtesting generally, confirming through your own historical analysis how reliably this pattern has actually preceded reversals for your specific approach.
| Item | Detail |
|---|---|
| Regulator | FSCA, fsca.co.za |
| Exchange control | SARB, resbank.co.za |
| Tax authority | SARS, sars.gov.za |
| JSE hours | 09:00-17:00 SAST Mon-Fri |
| Best forex session | 15:00-17:00 SAST |
| CGT annual exclusion | R50,000 (individuals) |
5. Combining divergence with support and resistance
Many traders specifically look for divergence occurring at or near significant support or resistance levels, treating this combination, a meaningful technical level plus a divergence signal, as giving more reliable confirmation than either signal would on its own, consistent with the broader principle of combining multiple analytical inputs thoughtfully.
It's worth treating this combination as a genuine application of the confluence principle discussed throughout this site's strategy content, a divergence signal occurring at a meaningful, independently identified support or resistance level carries more weight than the same divergence occurring at an arbitrary price point.
6. A balanced approach to using divergence in your own analysis
A balanced approach treats divergence as one additional input suggesting increased caution or alertness to a potential reversal, rather than as a standalone, sufficient trading signal triggering immediate action on its own, and benefits from the same rigorous personal backtesting to genuinely evaluate how reliably this signal has performed historically for your own particular instruments and timeframes.
Either way, letting the instrument's own volatility set the distance is sounder than picking a figure that looks tidy. volatility
Hidden divergence suggests the trend may continue.
Regular divergence occurs when price makes a higher high but an oscillator makes a lower high, suggesting potential reversal. Hidden divergence has the opposite structure and suggests trend continuation.
★ Why It Matters
Worth backtesting rather than assuming: divergence signals appear to have meaningfully different reliability on trending versus range-bound charts. Testing this distinction for your own traded instrument is more useful than a generic statistic about divergence overall.
✕ Common mistakes
- Trading divergence signals identically across trending and ranging markets. Reliability appears to differ meaningfully between these two conditions.
- Relying on divergence alone without other confirming analysis. It tends to work better combined with additional technical signals.
- Not backtesting divergence specifically for your traded instrument. Reliability varies enough between markets that generic statistics aren't sufficient.
- Treating every divergence signal as an imminent reversal. Some divergences persist for extended periods without an actual reversal occurring.
Key Takeaways
- Divergence occurs when price and an indicator move in opposite directions, sometimes signalling weakening momentum and a potential upcoming reversal.
- Divergence occurs when price and a momentum indicator like RSI move in opposite directions, sometimes signalling weakening momentum and a potential reversal.
- This works best combined with other confirming analysis rather than relied upon in isolation.
- Bullish divergence explained, with an example.
- Bearish divergence explained, with an example.
Frequently asked follow-up questions
Can divergence occur with indicators other than RSI?
Yes, similar divergence analysis can be applied to other momentum oscillators, since the underlying logic relates to momentum generally rather than being specific to any single indicator.
Does divergence work better on longer or shorter timeframes?
Some traders find divergence more reliable on longer timeframes given the reduced noise, though this varies and personal testing on your specific instruments is worthwhile.
Should I enter a trade immediately when I spot divergence?
Generally not recommended in isolation, given the limitations above. Combining divergence with other confirming signals gives more reliable entry timing.
