i Short answer
Leading economic indicators anticipate future economic activity before it occurs, while coincident indicators reflect current conditions as they're happening.
📋 ON THIS PAGE
1. Leading economic indicators explained
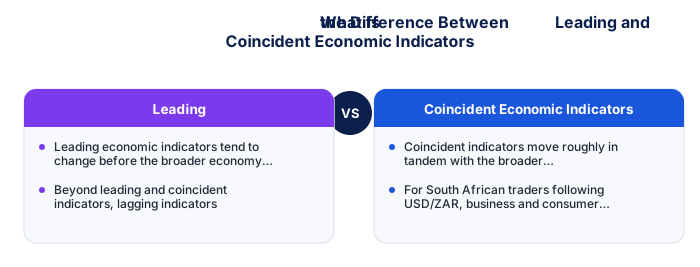
Leading economic indicators tend to change before the broader economy shifts direction, providing early signals of potential future economic trends, examples include new business formation data, building permits, and certain consumer confidence surveys, which often shift before broader economic activity itself fully reflects a changing trend.
It's worth understanding these as genuinely forward-looking measures worth watching specifically for anticipating future economic direction, unlike the technical chart indicators discussed elsewhere on this site, these operate on economic data releases rather than price action patterns.
2. Coincident economic indicators explained
Coincident indicators move roughly in tandem with the broader economy, reflecting current conditions as they're actually happening rather than anticipating future change. GDP data is a commonly cited example, since it directly measures current economic output rather than anticipating future shifts.
It's worth appreciating why these figures carry the most weight for confirming current economic reality, discussed elsewhere on this site regarding GDP data specifically, they describe what's genuinely happening right now, rather than predicting or confirming a past trend.
- Quantifiable rules remove subjectivity
- Backtestable on historical data
- Works consistently when edge is genuine
- Clear entry/exit criteria reduce hesitation
- Past performance does not guarantee future results
- Risk of overfitting to historical data
- Market regimes change, edges decay
- Requires discipline through drawdown periods
- Price and volume patterns
- Works on any liquid instrument
- Faster to learn basics
- Ignores fundamental context
- Economic and financial data
- Better for longer timeframes
- Deeper knowledge required
- Ignores entry precision
3. A third category: lagging economic indicators
Beyond leading and coincident indicators, lagging indicators confirm trends only after they've already become established. Unemployment data often falls into this category, since employment levels typically adjust only after broader economic activity has already shifted direction.
It's worth understanding why these still matter despite their delayed nature, unemployment figures, discussed elsewhere on this site, confirm and validate the broader economic narrative even though they arrive after the underlying conditions have already developed.
- Written entry/exit rules with zero ambiguity
- Backtested on minimum 3 years of data
- Walk-forward tested on out-of-sample data
- SA-specific events included in test period
- Maximum drawdown within personal tolerance
- 100+ live demo trades with consistent performance
| Type | When it signals | Examples | Use for traders |
|---|---|---|---|
| Leading | Before economic turning points | PMI, building permits, SARB leading indicator | Anticipate direction changes |
| Coincident | At the same time as the economy | GDP, employment, retail sales | Confirm current conditions |
| Lagging | After changes are established | Inflation, unemployment rate, prime rate | Validate trend has occurred |
4. Examples relevant to South African traders specifically
For South African traders following USD/ZAR, business and consumer confidence surveys function as leading indicators, GDP data functions as coincident, and unemployment data functions as lagging, together providing a more complete, time-staggered picture of the broader South African economic trajectory.
It's worth building your own mental checklist of which specific South African indicators fall into each category, having this framework helps you correctly weight new data releases as either forward-looking signal or backward-looking confirmation.
| Win rate | 1:1 RR | 1.5:1 RR | 2:1 RR |
|---|---|---|---|
| 40% | Losing | Break even | Profitable |
| 50% | Break even | Profitable | Profitable |
| 55% | Profitable | Profitable | Profitable |
| 60% | Profitable | Profitable | Profitable |
5. Why this categorisation helps organise fundamental analysis
Understanding which category a specific economic release falls into helps calibrate appropriate expectations. A leading indicator showing weakness might warrant watching for confirmation in subsequent coincident and lagging data, rather than assuming this single early signal alone provides complete, definitive confirmation of a broader economic shift.
It's worth applying this same leading-coincident-lagging framework whenever you encounter a new economic data release, quickly categorising any new figure helps you judge appropriately how much weight to give it in your broader fundamental analysis.
6. Combining this with the technical indicator discussion elsewhere
The same underlying timing-classification logic that applies to leading and lagging technical indicators also applies across both technical chart-based analysis and fundamental economic data. Recognising this parallel helps build a more unified, coherent analytical framework spanning both major analytical approaches.
Coincident indicators confirm what the economy is doing right now.
Leading indicators like PMI and consumer confidence signal likely future economic direction, making them more tradeable. Coincident indicators like GDP confirm the current economic state, useful for context rather than timing.
★ Why It Matters
Worth tracking: South African business confidence surveys as a leading indicator alongside the more commonly watched GDP figure. Leading indicators give earlier, if noisier, signals about economic direction than the lagging confirmation that GDP data ultimately provides.
✕ Common mistakes
- Treating all leading indicators as equally reliable. Their predictive value varies, and some carry more noise than others.
- Not distinguishing between these categories when reading economic commentary. This distinction clarifies what a given data point is actually telling you.
- Ignoring business confidence surveys despite their leading-indicator relevance. These often provide earlier signals than headline GDP figures.
Key Takeaways
- Leading economic indicators anticipate future activity while coincident indicators reflect current conditions, complementing the technical indicator distinction discussed elsewhere.
- Leading economic indicators anticipate future economic activity before it occurs, while coincident indicators reflect current conditions as they're happening.
- Leading economic indicators explained.
- Coincident economic indicators explained.
- A third category: lagging economic indicators.
See also: What Is a False Breakout Filter and How Does It Work?.
Frequently asked follow-up questions
Are leading indicators always more useful than coincident ones?
Not inherently. Each provides different, complementary information, with leading indicators offering earlier but sometimes less certain signals, similar to the technical indicator trade-off.
Can a single economic release fall into multiple categories?
Generally each specific release type is consistently categorised based on its typical timing relationship to broader economic activity, though interpretation can sometimes vary slightly by analyst.
Does this categorisation apply to data beyond South Africa specifically?
Yes, this is a general economic analysis framework applicable internationally, including to the US and other economic data relevant to USD/ZAR analysis.
