i Short answer
Independently testing a purchased indicator's actual signals against verified historical performance matters more than marketing claims or visually appealing demonstration videos.
📋 ON THIS PAGE
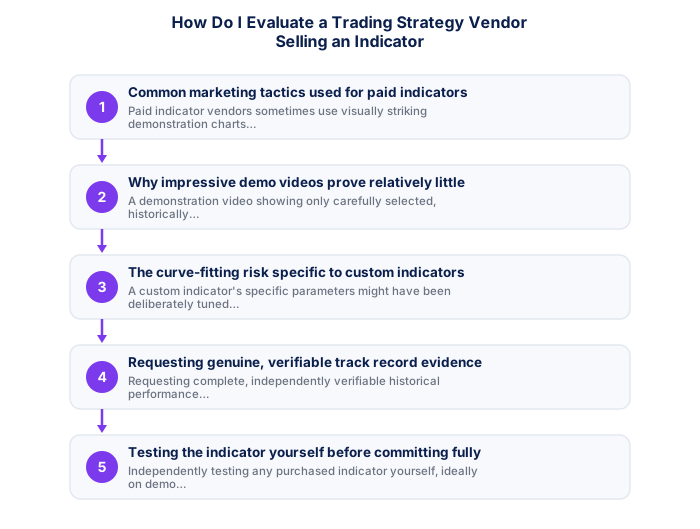
- Common marketing tactics used for paid indicators
- Why impressive demo videos prove relatively little
- The curve-fitting risk specific to custom indicators
- Requesting genuine, verifiable track record evidence
- Testing the indicator yourself before committing fully
- A practical evaluation checklist before purchasing
1. Common marketing tactics used for paid indicators
Paid indicator vendors sometimes use visually striking demonstration charts showing the indicator's signals appearing to predict significant moves perfectly, similar to the broader marketing concerns around course and mentor promotion generally, without necessarily providing genuinely independent, verified performance evidence behind these selected examples.
It's worth watching specifically for arrows or highlighted signals appearing exactly at chart turning points, that kind of visual is easy to produce with hindsight by simply choosing which signals to display after already knowing what price did next, worth recognising this specific presentation pattern as a red flag rather than genuine evidence of predictive value.
| Signal | Red Flag | Green Flag |
|---|---|---|
| Demo videos | Only cherry-picked winning trades | Includes losing trades too |
| Track record | Unverifiable | Independently verifiable |
| Trial availability | None offered | Trial or money-back period |
| Curve-fitting risk | Many adjustable parameters | Simple, few parameters |
2. Why impressive demo videos prove relatively little
A demonstration video showing only carefully selected, historically successful signal examples doesn't represent the indicator's genuine overall statistical performance across a complete, representative historical sample, making this kind of cherry-picked demonstration considerably less informative than it might initially appear.
It's worth asking yourself explicitly whether you're seeing a representative sample or a curated highlight reel, an indicator vendor showing five perfect signals says nothing about how many imperfect or losing signals occurred during that same period that simply weren't included in the demonstration.
- Quantifiable rules remove subjectivity
- Backtestable on historical data
- Works consistently when edge is genuine
- Clear entry/exit criteria reduce hesitation
- Past performance does not guarantee future results
- Risk of overfitting to historical data
- Market regimes change, edges decay
- Requires discipline through drawdown periods
- Price and volume patterns
- Works on any liquid instrument
- Faster to learn basics
- Ignores fundamental context
- Economic and financial data
- Better for longer timeframes
- Deeper knowledge required
- Ignores entry precision
3. The curve-fitting risk specific to custom indicators
A custom indicator's specific parameters might have been deliberately tuned to perform impressively on the particular historical period used for marketing purposes, the same overfitting risk that affects any backtesting exercise, without genuine robustness to perform similarly well on new, future, unseen market conditions.
It's worth being specifically sceptical of indicators with numerous adjustable parameters, each additional tunable setting increases the statistical risk that the version being marketed was optimised specifically to look impressive on the particular historical data used for that promotional demonstration.
- Written entry/exit rules with zero ambiguity
- Backtested on minimum 3 years of data
- Walk-forward tested on out-of-sample data
- SA-specific events included in test period
- Maximum drawdown within personal tolerance
- 100+ live demo trades with consistent performance
4. Requesting genuine, verifiable track record evidence
As with evaluating trading mentors and EA marketplaces, requesting complete, independently verifiable historical performance data, covering a complete period rather than only selectively impressive examples, provides more genuinely useful evidence than marketing materials alone.
It's worth being persistent but polite in this request, and treating a vendor's reluctance or inability to provide this kind of complete, unfiltered performance data as meaningful information in itself, a genuinely confident vendor with a real track record generally has little reason to withhold it.
| Win rate | 1:1 RR | 1.5:1 RR | 2:1 RR |
|---|---|---|---|
| 40% | Losing | Break even | Profitable |
| 50% | Break even | Profitable | Profitable |
| 55% | Profitable | Profitable | Profitable |
| 60% | Profitable | Profitable | Profitable |
5. Testing the indicator yourself before committing fully
Independently testing any purchased indicator yourself, ideally on demo first, across your own chosen historical period and instruments, provides your own genuine, current verification beyond whatever the vendor's own marketing materials claim.
It's worth budgeting genuine time for this independent testing before forming a final opinion, rather than making a purchase decision based purely on marketing material and rushing the verification afterward, testing first protects you from sunk-cost pressure to justify a purchase you've already made.
6. A practical evaluation checklist before purchasing
Before purchasing any indicator, checking for a free trial period allowing your own independent testing, seeking independent reviews beyond the vendor's own marketing, and applying healthy scepticism toward guaranteed-result claims, supports a more informed purchasing decision.
A vendor's demonstration chart often shows carefully selected, historically successful examples. Testing the indicator yourself against your own independent data gives a far more genuine read.
★ Why It Matters
Worth requesting directly before paying: ask for the indicator's signals plotted against several months of historical data you choose yourself, rather than the vendor's own selected example period, vendors confident in their product rarely hesitate at this request.
✕ Common mistakes
- Not asking for genuine, verifiable live performance. Backtested marketing materials can look very different from real results.
- Assuming a confident sales pitch reflects genuine product quality. These are independent things worth verifying separately.
- Buying before testing on a demo account first. A demo trial reveals real-world signal quality before any money changes hands.
Key Takeaways
- Independently testing a purchased indicator's actual signals against verified historical performance matters more than marketing claims or visually appealing demos.
- Independently testing a purchased indicator's actual signals against verified historical performance matters more than marketing claims or visually appealing demonstration videos.
- Common marketing tactics used for paid indicators.
- Why impressive demo videos prove relatively little.
- The curve-fitting risk specific to custom indicators.
See also: What Is a Trading Bot Marketplace and Should I Buy an EA? and What Are Common Trading Education Scams to Avoid?.
Frequently asked follow-up questions
Should I avoid all paid trading indicators entirely?
Not necessarily. Some genuinely useful indicators exist, provided you apply independent verification before relying on any specific purchased tool.
Can a free trial period help me evaluate an indicator properly?
Yes, this allows your own independent testing before fully committing financially to a specific indicator purchase.
Does a higher price indicate a more reliable indicator?
No, price alone isn't a reliable quality indicator, similar to the broader course and mentor pricing discussion elsewhere; independent testing matters considerably more.
