i Short answer
Fast-reacting indicators are commonly favoured for short-term trading: short-period moving averages, momentum oscillators like RSI, and volume-based indicators.
However, the fundamental lag inherent to all technical indicators still applies, regardless of timeframe.
📋 ON THIS PAGE
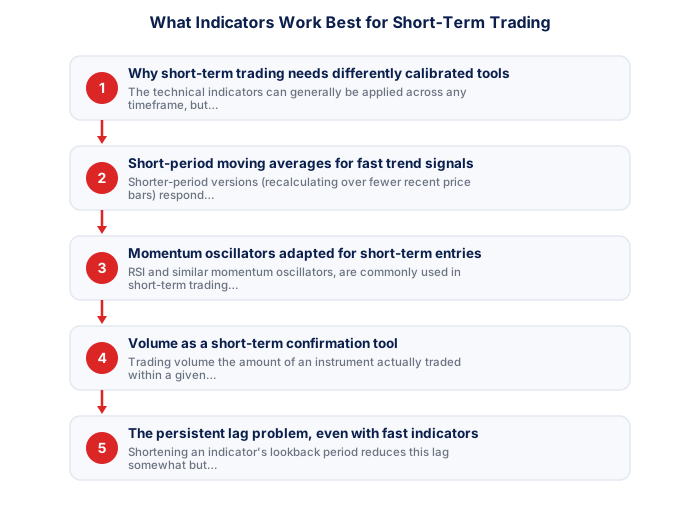
- Why short-term trading needs differently calibrated tools
- Short-period moving averages for fast trend signals
- Momentum oscillators adapted for short-term entries
- Volume as a short-term confirmation tool
- The persistent lag problem, even with fast indicators
- Combining indicators without overcomplicating a fast-paced approach
1. Why short-term trading needs differently calibrated tools
The technical indicators can generally be applied across any timeframe, but their specific parameter settings often need recalibration for short-term trading. An indicator setting well-suited to a daily chart, designed to smooth out short-term noise for longer-term analysis, would respond far too slowly to be useful for a day trader needing signals within minutes rather than days.
This recalibration, generally using shorter lookback periods across whatever specific indicators a trader chooses, is the main adaptation short-term traders make to the same broader indicator toolkit, rather than requiring an entirely different, exotic set of tools unique to short-term trading.
It's worth testing any indicator's specific settings through your own backtesting before relying on it live, default parameters designed for a general audience rarely suit the specific timeframe and instrument combination your own short-term strategy actually uses.
2. Short-period moving averages for fast trend signals
Shorter-period versions (recalculating over fewer recent price bars) respond more quickly to recent price changes than longer-period versions, making them more suitable for short-term trading where rapid trend identification matters more than the smoothing benefit longer periods provide.
Many short-term traders use a combination of a very short-period moving average alongside a slightly longer one, watching for crossovers between the two as a relatively fast-reacting trend signal, though this comes with the trade-off of generating more false signals during choppy, range-bound conditions compared to longer-period versions.
- Quantifiable rules remove subjectivity
- Backtestable on historical data
- Works consistently when edge is genuine
- Clear entry/exit criteria reduce hesitation
- Past performance does not guarantee future results
- Risk of overfitting to historical data
- Market regimes change, edges decay
- Requires discipline through drawdown periods
- Price and volume patterns
- Works on any liquid instrument
- Faster to learn basics
- Ignores fundamental context
- Economic and financial data
- Better for longer timeframes
- Deeper knowledge required
- Ignores entry precision
3. Momentum oscillators adapted for short-term entries
RSI and similar momentum oscillators, are commonly used in short-term trading with shortened lookback periods, aiming to identify short-term overbought or oversold conditions more responsively than the standard settings typically used for longer-term analysis.
The same cautionrading, a shortened-period RSI can generate frequent, sometimes unreliable signals during fast-moving short-term price action, making the broader context awareness particularly important when using this tool for rapid, short-term decisions.
- Written entry/exit rules with zero ambiguity
- Backtested on minimum 3 years of data
- Walk-forward tested on out-of-sample data
- SA-specific events included in test period
- Maximum drawdown within personal tolerance
- 100+ live demo trades with consistent performance
4. Volume as a short-term confirmation tool
Trading volume, the amount of an instrument actually traded within a given period, is often used by short-term traders as a confirmation tool, since a price move accompanied by genuinely elevated volume is generally considered more significant and reliable than the identical price move occurring on unusually low volume, which might suggest a less committed, less reliable move.
This volume-based confirmation is particularly relevant for short-term trading specifically, since rapid price movements without corresponding volume support can sometimes reverse just as quickly, making volume a useful additional filter alongside the price-based indicators.
| Win rate | 1:1 RR | 1.5:1 RR | 2:1 RR |
|---|---|---|---|
| 40% | Losing | Break even | Profitable |
| 50% | Break even | Profitable | Profitable |
| 55% | Profitable | Profitable | Profitable |
| 60% | Profitable | Profitable | Profitable |
5. The persistent lag problem, even with fast indicators
All indicators derived from historical price data carry an inherent lag, confirming or describing price movement that has already at least partially occurred. Shortening an indicator's lookback period reduces this lag somewhat but doesn't eliminate it entirely, there's a genuine, unavoidable mathematical limit to how responsive any indicator calculated from past price data can become.
This means even the fastest-reacting indicators available to short-term traders still carry some degree of lag relative to the absolute, instantaneous current price, a limitation worth understanding clearly rather than assuming sufficiently short indicator settings can somehow eliminate this fundamental property entirely.
It's worth accepting this limitation as fundamental rather than a flaw to eliminate through finding the perfect indicator, every indicator, by mathematical necessity, derives its signal from price that has already happened, worth building your strategy around this reality rather than searching for a genuinely lag-free tool that doesn't exist.
6. Combining indicators without overcomplicating a fast-paced approach
Given the rapid pace short-term trading demands, the indicator-overload caution, a short-term trader needing to process multiple conflicting signals quickly, under genuine time pressure, faces a considerably harder analytical task than a longer-term trader with more time to deliberate.
Many successful short-term traders deliberately limit themselves to a small, well-understood combination of tools, perhaps a fast moving average for trend direction and a volume confirmation, discussed above, rather than attempting to process numerous indicators simultaneously within the brief decision windows short-term trading actually allows.
For a trader in South Africa, the late afternoon carries the heaviest volume, because that is when the two largest sessions overlap. liquidity
Oscillators work best in ranging conditions, can fail in strong trends.
Trend-following indicators like moving averages and MACD work best in trending markets. Oscillators like RSI work best in ranging conditions but can produce misleading signals in strong trends.
★ Why It Matters
Worth testing directly on your own setup: the same indicator's settings optimised for a 5-minute chart rarely transfer well to a 1-minute chart without retuning the parameters, traders sometimes blame an indicator for poor signals when the real issue is using settings tuned for a different timeframe.
✕ Common mistakes
- Blaming an indicator for poor signals caused by mismatched settings. The real issue is sometimes the parameters, not the indicator itself.
- Stacking too many fast-reacting indicators simultaneously. This can create conflicting signals rather than added clarity.
- Ignoring the inherent lag in all technical indicators regardless of speed. Even fast indicators are derived from price that has already happened.
Key Takeaways
- Fast-reacting indicators like short-period moving averages and momentum oscillators are commonly used for short-term trading, but lag remains a challenge.
- Fast-reacting indicators are commonly favoured for short-term trading: short-period moving averages, momentum oscillators like RSI, and volume-based indicators.
- However, the fundamental lag inherent to all technical indicators still applies, regardless of timeframe.
- Why short-term trading needs differently calibrated tools.
- Short-period moving averages for fast trend signals.
See also: What Is Support and Resistance and How Do I Identify It? and What Is Opening Range Breakout Trading?.
Frequently asked follow-up questions
Should I use completely different indicators for scalping versus day trading?
Generally not different indicators entirely, but often even shorter period settings for scalping specifically, given its even more compressed timeframe compared to standard day trading.
Can volume indicators be used on all instruments?
Volume data quality and availability can vary by instrument and broker, particularly for some CFD products versus directly exchange-traded instruments; checking your specific platform's volume data reliability is worthwhile.
Is it better to use fewer indicators for fast-paced trading?
Yes, generally, the rapid decision-making short-term trading requires favours a small, well-understood toolkit over attempting to process many indicators simultaneously under time pressure.
