What this page covers
Statistics South Africa publishes the consumer price index monthly, usually mid month for the month before. The Reserve Bank sets policy against it, so the print is the single most watched local number for rate expectations.
★ What changed this year
Inflation rose sharply through the middle of 2026. It was 3.0% in February, the low for the year, then climbed for five consecutive months to 5.0% in June before easing to 4.3% in July and 4.4% in August.
Fuel did almost all of it. Transport inflation reached 12.7% in June, with diesel up 50.8% and petrol up 31.7% over twelve months, on the back of the Middle East conflict and the disruption to shipping through the Strait of Hormuz. Inflation excluding fuel was 3.7% in May, which is roughly where it had been all year. That gap is why the Reserve Bank raised rates twice while describing the shock as one it expects to fade.
| Month | Headline CPI, year on year |
|---|---|
| August 2026 | 4.4% |
| July 2026 | 4.3% |
| June 2026 | 4.1% |
| May 2026 | 3.8% |
| April 2026 | 3.6% |
| March 2026 | 3.4% |
| February 2026 | 3.2% |
| January 2026 | 3.1% |
| Item | Detail |
|---|---|
| Previous target band | 3% to 6% |
| Current objective | 3%, with the Reserve Bank steering toward the point rather than the band |
| Measure targeted | Headline CPI, year on year |
| Published by | Statistics South Africa, monthly |
| Typical release | Mid month, for the preceding month |
| Year | Average headline CPI | Context |
|---|---|---|
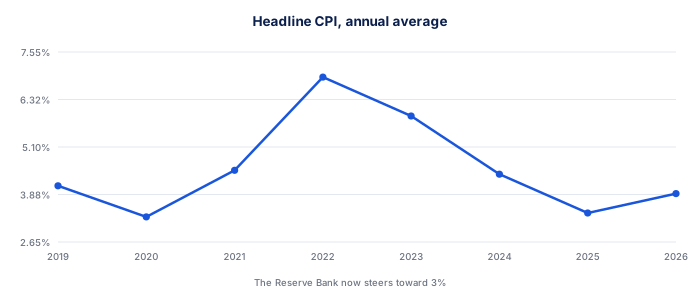
| 2026 to date | about 3.9% | Rising from the 2025 low |
| 2025 | about 3.4% | Below the old band's midpoint |
| 2024 | about 4.4% | Easing through the year |
| 2023 | about 5.9% | Falling from the peak |
| 2022 | about 6.9% | Peaked at 7.8% in July |
| 2021 | about 4.5% | The surge beginning |
| 2020 | about 3.3% | Pandemic demand collapse |
| Held for | At 3% | At 4.4% | At 6% |
|---|---|---|---|
| 5 years | R100 buys R86 | R100 buys R81 | R100 buys R75 |
| 10 years | R100 buys R74 | R100 buys R65 | R100 buys R56 |
| 20 years | R100 buys R55 | R100 buys R42 | R100 buys R31 |
| Year | Average headline CPI | Repo at year end | Real repo rate | Note |
|---|---|---|---|---|
| 2026 | 4.2% | 7.25% | 3.05% | Fuel shock from the Middle East conflict |
| 2025 | 3.2% | 6.75% | 3.55% | Lowest annual average in 21 years |
| 2024 | 4.4% | 7.75% | 3.35% | Easing through the year |
| 2023 | 5.9% | 8.25% | 2.35% | Falling from the peak |
| 2022 | 6.9% | 7.00% | 0.10% | Peaked at 7.8% in July |
| 2021 | 4.5% | 3.75% | -0.75% | Negative real rates |
| 2020 | 3.3% | 3.50% | 0.20% | Pandemic demand collapse |
| 2019 | 4.1% | 6.50% | 2.40% | Inside the old band |
| 2018 | 4.6% | 6.75% | 2.15% | VAT rose to 15% |
| 2017 | 5.3% | 6.75% | 1.45% | Easing after the drought |
| 2016 | 6.3% | 7.00% | 0.70% | Above the band, drought driven |
| 2015 | 4.6% | 6.25% | 1.65% | Oil price collapse helped |
| 2014 | 6.1% | 5.75% | -0.35% | Above the band |
| 2013 | 5.7% | 5.00% | -0.70% | Rand weakness feeding through |
| 2012 | 5.7% | 5.00% | -0.70% | Stable but elevated |
| 2011 | 5.0% | 5.50% | 0.50% | Rising from the trough |
| 2010 | 4.3% | 5.50% | 1.20% | Post-crisis low |
| 2009 | 7.1% | 7.00% | -0.10% | Falling from the 2008 spike |
| 2008 | 11.5% | 12.00% | 0.50% | Food and fuel spike |
| 2007 | 7.1% | 11.00% | 3.90% | Breaking above the band |
| 2006 | 4.6% | 9.00% | 4.40% | Inside the band |
| 2005 | 3.4% | 7.00% | 3.60% | Low and stable |
| 2004 | 1.4% | 7.50% | 6.10% | Lowest on the modern series |
| 2003 | 5.8% | 8.00% | 2.20% | Falling sharply |
| 2002 | 9.2% | 13.50% | 4.30% | Rand collapse feeding through |
| 2001 | 5.7% | 9.50% | 3.80% | Before the currency crisis |
| 2000 | 5.3% | 12.00% | 6.70% | Inflation targeting introduced |

Download this data
Every table on this page as a spreadsheet, with the source and the date it was checked in the header rows.
⬇ Download CSVHow these figures work
The consumer price index measures the cost of a fixed basket of goods and services, weighted by how much households actually spend on each. Statistics South Africa publishes it monthly, and the year on year change is what is quoted as the inflation rate.
Headline CPI includes everything. Core strips out food, non-alcoholic beverages, fuel and energy, because those move on global prices and weather rather than on domestic demand. The Reserve Bank watches both: headline is the target, core tells it whether the pressure is broad.
★ A worked example
A fixed deposit paying 8.25% with inflation at 4.4%.
The real return before tax is not 3.85% but slightly less, because the calculation compounds: 1.0825 divided by 1.044 gives 1.0369, a real return of 3.69%.
Then tax applies to the nominal interest, not the real return. At a 31% marginal rate the after-tax nominal return is 5.69%, which against 4.4% inflation leaves a real return of about 1.24%. That gap between the advertised rate and what is actually earned is the reason cash struggles over long horizons.
✕ Common mistakes
- Subtracting inflation from the nominal rate. The correct calculation divides rather than subtracts. At low rates the difference is small; at high rates it is not.
- Ignoring tax on interest. Interest is taxed at the marginal rate on the nominal amount. The real after-tax return is often close to zero.
- Reacting to a single month. A monthly print is noisy. The MPC responds to the trend and to its own forecast rather than to one release.
- Assuming your inflation matches the index. The basket is a national average. A household with a large fuel or medical share of spending experiences something quite different.
Notes on reading these figures
- Core inflation strips out food, non-alcoholic beverages, fuel and energy. The Reserve Bank watches it because it shows whether price pressure is broad or concentrated in items policy cannot influence.
- A single month rarely changes policy. The MPC reacts to the trend and to its own forecast, which is published with each statement.
- Inflation erodes a nominal return. A fixed deposit paying 8% with inflation at 4.4% returns about 3.4% in real terms before tax, which is the comparison that matters for a long horizon.
To put these figures to work, the Inflation Calculator runs the arithmetic on your own numbers, and SARB Repo Rate History covers the same ground in ordinary language. How inflation data affects traders and SARB MPC Meeting Calendar go into the detail this table only summarises.
Terms used on this page
Put this table on your own site
The table below can sit on your own page and stays current without you editing anything.
- Preview the embeddable table as it will appear on your site
Place this snippet on your page and the table is embedded live, rather than copied and left to age.
<iframe src="https://www.tradeanswers.co.za/embed/ref-south-african-inflation-cpi-history.html" width="100%" height="620" style="border:0" title="South African Inflation (CPI) History"></iframe>Free to use with attribution. The link back to this page is built into the embed.
Frequently asked questions
Who publishes South African inflation?
Statistics South Africa, monthly, usually mid month for the preceding month. The Reserve Bank uses it to set policy.
What is the difference between headline and core?
Core excludes food, non-alcoholic beverages, fuel and energy. It shows whether price pressure is broad or concentrated in items policy cannot influence.
What is the inflation target?
The Reserve Bank has moved toward a 3% objective, having previously worked within a 3% to 6% band.
How does inflation affect a trading account?
It erodes the real value of the balance and of any nominal return. A 10% year with 4.4% inflation is a real gain of about 5.4%.
Why did my costs rise more than the index?
The basket weights national average spending. Fuel, medical aid and education have all run above the headline figure for extended periods.
Does inflation move the rand?
Indirectly, through what it implies for interest rates. A high print raises the chance of a rate increase, which supports the rand through the carry differential.