i Short answer
This test deliberately introduces small, controlled parameter changes to check how sensitive a strategy's backtested results are to these adjustments.
It reveals genuine robustness versus fragile, narrowly-tuned overfitting.
📋 ON THIS PAGE
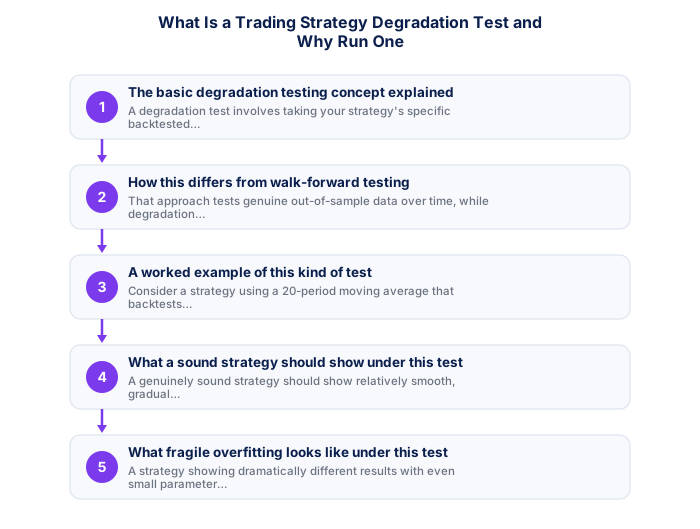
1. The basic degradation testing concept explained
A degradation test involves taking your strategy's specific backtested parameters, perhaps a particular moving average period or stop-loss distance, and deliberately testing slightly different nearby values, checking whether results remain reasonably similar or whether they degrade dramatically with even small adjustments.
It's worth thinking of this specifically as a stress test for your strategy's underlying assumptions, deliberately introducing realistic imperfections, delayed entries, wider spreads, missed signals, reveals whether your strategy's edge is genuinely sound or whether it depends on unrealistically perfect execution.
2. How this differs from walk-forward testing
Walk-forward testing tests genuine out-of-sample data over time, while degradation testing specifically tests parameter sensitivity within your existing data. These are complementary but distinct approaches to assessing genuine strategy robustness.
It's worth using both testing approaches together for a genuinely thorough evaluation, walk-forward testing, discussed elsewhere on this site, checks whether your strategy performs well on new, unseen data, while degradation testing checks whether it remains sound under imperfect real-world conditions, two distinct and complementary questions.
- Quantifiable rules remove subjectivity
- Backtestable on historical data
- Works consistently when edge is genuine
- Clear entry/exit criteria reduce hesitation
- Past performance does not guarantee future results
- Risk of overfitting to historical data
- Market regimes change, edges decay
- Requires discipline through drawdown periods
- Price and volume patterns
- Works on any liquid instrument
- Faster to learn basics
- Ignores fundamental context
- Economic and financial data
- Better for longer timeframes
- Deeper knowledge required
- Ignores entry precision
South African traders who backtest their strategies should use historical data that includes periods of rand volatility and SA-specific events such as budget speeches, credit rating decisions, and periods of high load shedding. A strategy that performs well on global historical data but was not tested against SA-specific market conditions may behave differently when applied to ZAR instruments. Including at least one cycle of SARB rate changes and one period of political uncertainty in your historical test set provides a more realistic assessment of performance.
3. A worked example of this kind of test
Consider a strategy using a 20-period moving average that backtests impressively, a degradation test would check whether a 18-period or 22-period average produces meaningfully similar results, or whether performance collapses dramatically with this small adjustment, revealing whether the original 20-period figure reflects genuine edge or simply curve-fitted coincidence.
It's worth running this exact process on your own specific strategy using your own backtested trade log, rather than a hypothetical example, seeing your own concrete results under these deliberately introduced imperfections gives genuinely personal, actionable insight into your strategy's real-world robustness.
- Written entry/exit rules with zero ambiguity
- Backtested on minimum 3 years of data
- Walk-forward tested on out-of-sample data
- SA-specific events included in test period
- Maximum drawdown within personal tolerance
- 100+ live demo trades with consistent performance
4. What a sound strategy should show under this test
A genuinely sound strategy should show relatively smooth, gradual performance changes as parameters shift slightly, suggesting the underlying edge reflects a genuine, broader market phenomenon rather than a narrowly-tuned coincidence specific to one exact parameter value.
It's worth defining your own acceptable degradation threshold explicitly before running this test, deciding in advance what percentage decline in performance you'd consider acceptable, rather than judging your results reactively after already seeing them, keeps your evaluation genuinely objective.
| Win rate | 1:1 RR | 1.5:1 RR | 2:1 RR |
|---|---|---|---|
| 40% | Losing | Break even | Profitable |
| 50% | Break even | Profitable | Profitable |
| 55% | Profitable | Profitable | Profitable |
| 60% | Profitable | Profitable | Profitable |
5. What fragile overfitting looks like under this test
A strategy showing dramatically different results with even small parameter adjustments, performing excellently at one exact value but poorly just slightly away from it, suggests the original impressive result likely reflects curve-fitted coincidence rather than genuine, sound edge, exactly the kind of overfitting to watch for.
It's worth treating a strategy that fails this specific test as a genuine warning sign worth taking seriously, rather than dismissing the degraded results as unrealistic pessimism, a strategy that only works under unrealistically perfect conditions is precisely the kind of overfit result discussed elsewhere on this site regarding backtesting risks.
6. Incorporating this into your own strategy development process
Running this kind of degradation test alongside walk-forward testing, before committing real capital to a strategy that initially looks impressive, gives important additional confidence in its genuine robustness.
A strategy degradation test compares recent performance against the full historical baseline. A statistically meaningful deterioration in expectancy suggests the edge may have degraded, warranting a review.
★ Why It Matters
Worth running before trusting a backtest: vary just the entry timing by a few minutes or the stop-loss distance by a small percentage and rerun the test. A strategy whose results collapse from minor tweaks like this was likely curve-fit to specific historical noise rather than a genuine, sound pattern.
✕ Common mistakes
- Skipping this test for a strategy that performed well in backtesting. Strong backtested results alone don't confirm genuine robustness.
- Treating a strategy that survives minor parameter changes the same as one that collapses from them. The latter is a clear sign of overfitting to historical noise.
- Testing too many parameters simultaneously, making results hard to interpret. Adjusting one variable at a time gives clearer, more useful results.
- Not repeating this test periodically as new data accumulates. A strategy's robustness can be reassessed as conditions evolve.
Key Takeaways
- This test deliberately introduces small parameter changes to check how sensitive a strategy's results are, revealing genuine robustness versus fragile overfitting.
- This test deliberately introduces small, controlled parameter changes to check how sensitive a strategy's backtested results are to these adjustments.
- It reveals genuine robustness versus fragile, narrowly-tuned overfitting.
- The basic degradation testing concept explained.
- How this differs from walk-forward testing.
See also: What Is the Best Trading Strategy for a Beginner?.
Frequently asked follow-up questions
How many nearby parameter values should I typically test?
Testing several values both above and below your original parameter gives a reasonably thorough sensitivity picture without requiring an exhaustive, impractical number of tests.
Can this test be automated using backtesting software?
Yes, many backtesting platforms support this kind of parameter sweep testing directly, making this process considerably more efficient than manual testing.
Does passing a degradation test guarantee future profitability?
No, this improves confidence in genuine robustness but doesn't guarantee future results, given inherent market uncertainty.
Should I run this test before or after walk-forward testing?
Many traders find value in both, potentially running degradation testing first to refine parameters before subjecting the strategy to walk-forward validation.
Is this test relevant for discretionary strategies without fixed numerical parameters?
This is more directly applicable to systematic, rule-based strategies. Discretionary approaches require different kinds of robustness assessment instead.
