What this page covers
The JSE uses the Industry Classification Benchmark, the same scheme as most global exchanges. Knowing which sector a share sits in tells you what it will react to, which is usually more useful than knowing its index weight.
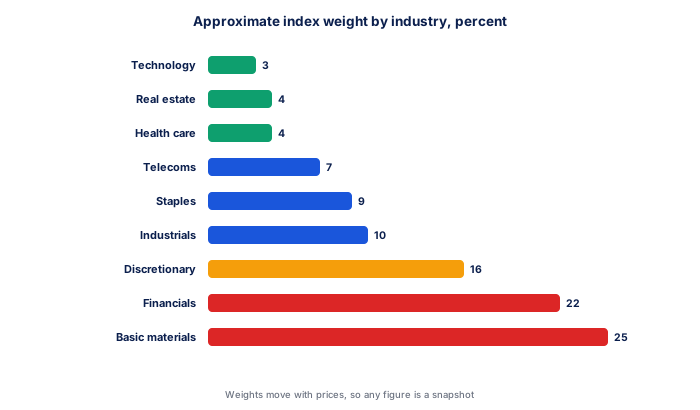
| Industry | Approximate index weight | Primary driver |
|---|---|---|
| Basic materials | About 25% | Commodity prices and the rand |
| Financials | About 22% | Interest rates and credit quality |
| Consumer discretionary | About 16% | Household income and confidence |
| Industrials | About 10% | Global growth and logistics |
| Consumer staples | About 9% | Food inflation and volumes |
| Telecommunications | About 7% | Regulation and subscriber growth |
| Health care | About 4% | Policy, including NHI |
| Real estate | About 4% | The long bond yield |
| Technology | About 3% | Global sentiment |
| Type | Earnings mostly from | A weaker rand |
|---|---|---|
| Dual listed industrials | Offshore | Helps |
| Mining and resources | Offshore, commodity priced in dollars | Helps |
| Banks | South Africa | Neutral to negative |
| Retailers | South Africa | Hurts, through import costs |
| Listed property | South Africa mostly | Hurts, through the bond yield |
| Telecoms | Mixed, significant African exposure | Mixed |
| Index | Covers |
|---|---|
| Resources 10 | The ten largest resource counters |
| Financial 15 | The fifteen largest financials |
| Industrial 25 | The twenty-five largest industrials |
| SA Listed Property | Listed property, formerly SAPY |
| Top 40 | The forty largest across all sectors |

Download this data
Every table on this page as a spreadsheet, with the source and the date it was checked in the header rows.
⬇ Download CSVHow these figures work
The figures on this page come from published sources and change on a schedule rather than continuously, which is what makes them worth recording in one place. Sector weights move with prices, so a commodity rally raises basic materials' weight without a single share being added. Weights quoted anywhere are a snapshot.
The rand hedge distinction matters more on the JSE than sector does. Two industrials can react in opposite directions to the same rand move depending on where they earn.
★ A worked example
Reading the tables together is where the value is. A sector index is not a diversified portfolio. Resources 10 is dominated by a handful of names, and concentration within a sector is often higher than across the market.
✕ Common mistakes
- Sector weights move with prices, so a commodity rally raises basic mat. Sector weights move with prices, so a commodity rally raises basic materials' weight without a single share being added. Weights quoted anywhere are a snapshot.
- The rand hedge distinction matters more on the JSE than sector does. The rand hedge distinction matters more on the JSE than sector does. Two industrials can react in opposite directions to the same rand move depending on where they earn.
- A sector index is not a diversified portfolio. A sector index is not a diversified portfolio. Resources 10 is dominated by a handful of names, and concentration within a sector is often higher than across the market.
- Taking a figure without its date. A number from a reference page is only as good as when it was last checked, which is why the date sits at the top of this one.
Notes on reading these figures
- Sector weights move with prices, so a commodity rally raises basic materials' weight without a single share being added. Weights quoted anywhere are a snapshot.
- The rand hedge distinction matters more on the JSE than sector does. Two industrials can react in opposite directions to the same rand move depending on where they earn.
- A sector index is not a diversified portfolio. Resources 10 is dominated by a handful of names, and concentration within a sector is often higher than across the market.
To put these figures to work, the JSE Indices Reference runs the arithmetic on your own numbers, and JSE ETF Reference covers the same ground in ordinary language. Mining and the rand and Most Actively Traded JSE Shares go into the detail this table only summarises. The Beta Calculator covers the part this table leaves out.
Put this table on your own site
The table below can sit on your own page and stays current without you editing anything.
- Preview the embeddable table as it will appear on your site
Place this snippet on your page and the table is embedded live, rather than copied and left to age.
<iframe src="https://www.tradeanswers.co.za/embed/ref-jse-sectors-reference.html" width="100%" height="620" style="border:0" title="JSE Sectors Reference"></iframe>Free to use with attribution. The link back to this page is built into the embed.
Terms used on this page
Frequently asked questions
What classification does the JSE use?
The Industry Classification Benchmark, the same scheme as most global exchanges.
Which sector is largest?
Basic materials, at about 25% of index weight, followed by financials at about 22%.
What is a rand hedge?
A company earning mostly offshore, whose rand earnings rise when the rand weakens. Most large JSE industrials and miners qualify.
Do sector weights change?
Continuously, because they move with price. A commodity rally raises basic materials' weight without a single share being added.
Is a sector index diversified?
Less than the market. Resources 10 is dominated by a handful of names, and within-sector concentration is often higher than across it.
Why do two industrials move differently?
Usually because one earns offshore and the other domestically. On the JSE that distinction matters more than sector.