What this page covers
Statistics South Africa publishes two unemployment rates each quarter, and they differ by more than ten percentage points. Which one is quoted changes the picture substantially, so both are shown here.
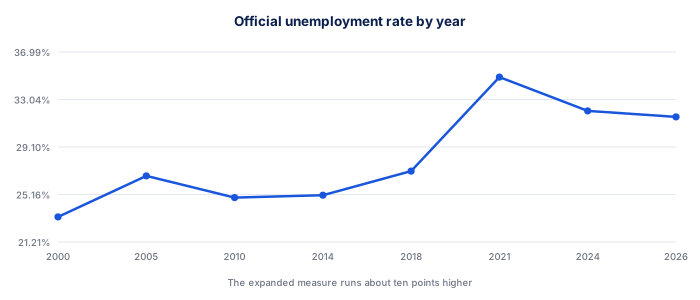
| Year | Official rate | Expanded rate | Youth, 15 to 24 |
|---|---|---|---|
| 2026 | 31.6% | 41.2% | 59.4% |
| 2025 | 32.1% | 41.9% | 60.2% |
| 2024 | 32.1% | 41.9% | 60.8% |
| 2023 | 32.1% | 41.1% | 60.7% |
| 2022 | 33.5% | 42.6% | 61.4% |
| 2021 | 34.9% | 46.2% | 66.5% |
| 2020 | 32.5% | 42.6% | 63.2% |
| 2019 | 29.1% | 38.7% | 58.2% |
| 2018 | 27.1% | 37.0% | 55.2% |
| 2016 | 26.7% | 35.6% | 54.4% |
| 2014 | 25.1% | 34.6% | 51.3% |
| 2012 | 24.9% | 35.6% | 51.5% |
| 2010 | 24.9% | 35.8% | 51.0% |
| 2008 | 22.5% | 31.2% | 45.9% |
| 2005 | 26.7% | 38.8% | 50.1% |
| 2002 | 29.4% | 41.8% | 54.2% |
| 2000 | 23.3% | 35.9% | 45.5% |
| Measure | Counts as unemployed |
|---|---|
| Official, narrow | Without work, available to work, and actively looked in the past four weeks |
| Expanded | Without work and available, whether or not they looked |
| The gap | Discouraged work seekers who have stopped looking |
| Labour force participation | Those working or actively looking, as a share of working-age population |
| Item | Effect |
|---|---|
| Rand | Limited direct effect; it is a slow variable |
| Bonds | Feeds the fiscal debate through the social grant burden |
| Retail shares | A leading indicator for consumer demand |
| Policy | Central to the growth debate, and to ratings commentary |

Download this data
Every table on this page as a spreadsheet, with the source and the date it was checked in the header rows.
⬇ Download CSVHow these figures work
The figures on this page come from published sources and change on a schedule rather than continuously, which is what makes them worth recording in one place. The expanded rate is the one most economists watch, because a discouraged work seeker is still unemployed in every sense except the statistical one.
Youth unemployment near 60% is the figure that drives most policy discussion. It is roughly double the national rate on either definition.
★ A worked example
Reading the tables together is where the value is. Unemployment data rarely moves the rand on the day. Its effect runs through the fiscal outlook and the growth forecast, which show up in bond yields over months.
✕ Common mistakes
- The expanded rate is the one most economists watch, because a discoura. The expanded rate is the one most economists watch, because a discouraged work seeker is still unemployed in every sense except the statistical one.
- Youth unemployment near 60% is the figure that drives most policy disc. Youth unemployment near 60% is the figure that drives most policy discussion. It is roughly double the national rate on either definition.
- Unemployment data rarely moves the rand on the day. Unemployment data rarely moves the rand on the day. Its effect runs through the fiscal outlook and the growth forecast, which show up in bond yields over months.
- Taking a figure without its date. A number from a reference page is only as good as when it was last checked, which is why the date sits at the top of this one.
Notes on reading these figures
- The expanded rate is the one most economists watch, because a discouraged work seeker is still unemployed in every sense except the statistical one.
- Youth unemployment near 60% is the figure that drives most policy discussion. It is roughly double the national rate on either definition.
- Unemployment data rarely moves the rand on the day. Its effect runs through the fiscal outlook and the growth forecast, which show up in bond yields over months.
To put these figures to work, the How unemployment data affects sentiment runs the arithmetic on your own numbers, and South African GDP Growth History covers the same ground in ordinary language. South African Inflation History and Unemployment and markets go into the detail this table only summarises. The Rand Exchange Rate History covers the part this table leaves out.
Put this table on your own site
The table below can sit on your own page and stays current without you editing anything.
- Preview the embeddable table as it will appear on your site
Add the code below to your own site. The table it renders is served from here, so it never goes stale.
<iframe src="https://www.tradeanswers.co.za/embed/ref-south-african-unemployment-rate-history.html" width="100%" height="620" style="border:0" title="South African Unemployment Rate History"></iframe>Free to use with attribution. The link back to this page is built into the embed.
Terms used on this page
Frequently asked questions
Why are there two unemployment rates?
The official rate counts only those who actively looked for work in the past four weeks. The expanded rate includes discouraged work seekers.
Which is the more accurate measure?
The expanded rate is what most economists watch, because someone who has stopped looking is still unemployed in every sense but the statistical one.
How high is youth unemployment?
Around 60% for those aged 15 to 24, on either measure, which is roughly double the national rate.
Does unemployment data move markets?
Rarely on the day. Its effect runs through the fiscal outlook and the growth forecast, showing up in bond yields over months.
Who publishes it?
Statistics South Africa, through the Quarterly Labour Force Survey.
What is labour force participation?
Those working or actively looking, as a share of the working-age population. A falling participation rate can lower the official unemployment rate without anyone finding work.