What this page covers
The rand is among the most traded emerging market currencies and among the most volatile. The series below shows where it closed each year and what was driving it, which is the context a single quote cannot give.
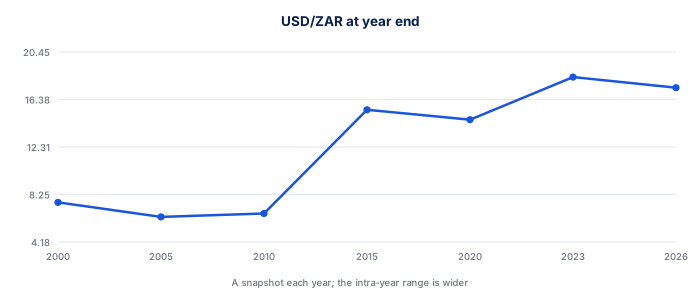
| Year | USD/ZAR | EUR/ZAR | GBP/ZAR | What moved it |
|---|---|---|---|---|
| 2026 | 16.40 | 17.80 | 21.60 | Gold strength and carry supported the rand |
| 2025 | 16.57 | 18.30 | 21.40 | Disinflation and a softer dollar |
| 2024 | 18.90 | 19.60 | 23.70 | Post-election coalition relief |
| 2023 | 18.30 | 20.20 | 23.30 | Load shedding and grey listing |
| 2022 | 17.00 | 18.20 | 20.50 | Global tightening cycle |
| 2021 | 15.95 | 18.10 | 21.50 | Commodity strength offset by unrest |
| 2020 | 14.65 | 18.00 | 20.00 | Pandemic shock then recovery |
| 2019 | 14.00 | 15.70 | 18.40 | Eskom and growth concerns |
| 2018 | 14.35 | 16.40 | 18.30 | Emerging market selloff |
| 2017 | 12.35 | 14.80 | 16.70 | Political change rally |
| 2016 | 13.70 | 14.40 | 16.90 | Recovery after Nenegate |
| 2015 | 15.50 | 16.90 | 22.90 | Nenegate in December |
| 2014 | 11.60 | 14.00 | 18.00 | Commodity price decline |
| 2012 | 8.47 | 11.20 | 13.70 | Marikana and downgrades |
| 2010 | 6.62 | 8.85 | 10.30 | Post-crisis commodity boom |
| 2008 | 9.30 | 13.10 | 13.50 | Global financial crisis |
| 2005 | 6.33 | 7.50 | 10.90 | Commodity cycle strength |
| 2002 | 8.64 | 9.05 | 13.90 | Recovery after the 2001 collapse |
| 2001 | 12.13 | 10.70 | 17.60 | Currency crisis |
| 2000 | 7.57 | 7.05 | 11.30 | Before the collapse |
| Factor | Direction | Speed |
|---|---|---|
| Repo rate relative to the dollar | Higher local rates support the rand | Immediate |
| Commodity prices | Higher supports the rand | Days to weeks |
| Global risk appetite | Risk-on supports the rand | Immediate |
| Current account balance | A smaller deficit supports the rand | Quarters |
| Political events | Uncertainty weakens the rand | Immediate and lasting |
| Amount | At R16.40 | At R17.50 | Difference |
|---|---|---|---|
| R100,000 | USD 6,098 | USD 5,714 | USD 384 |
| R500,000 | USD 30,488 | USD 28,571 | USD 1,917 |
| R1,000,000 | USD 60,976 | USD 57,143 | USD 3,833 |
| R2,000,000 | USD 121,951 | USD 114,286 | USD 7,665 |

Download this data
Every table on this page as a spreadsheet, with the source and the date it was checked in the header rows.
⬇ Download CSVHow these figures work
The figures on this page come from published sources and change on a schedule rather than continuously, which is what makes them worth recording in one place. Year-end rates are a snapshot, not an average. The rand's intra-year range is often wider than the gap between two year ends, which is why a chart of closes understates how volatile it has been.
The rand trades around the clock, but its deepest liquidity is during the London session. Gaps at the Monday open are common after weekend news.
★ A worked example
Reading the tables together is where the value is. A weaker rand raises the rand value of offshore assets, which is why offshore exposure has historically worked as a hedge for South African investors.
✕ Common mistakes
- Year-end rates are a snapshot, not an average. Year-end rates are a snapshot, not an average. The rand's intra-year range is often wider than the gap between two year ends, which is why a chart of closes understates how volatile it has been.
- The rand trades around the clock, but its deepest liquidity is during . The rand trades around the clock, but its deepest liquidity is during the London session. Gaps at the Monday open are common after weekend news.
- A weaker rand raises the rand value of offshore assets, which is why o. A weaker rand raises the rand value of offshore assets, which is why offshore exposure has historically worked as a hedge for South African investors.
- Taking a figure without its date. A number from a reference page is only as good as when it was last checked, which is why the date sits at the top of this one.
Notes on reading these figures
- Year-end rates are a snapshot, not an average. The rand's intra-year range is often wider than the gap between two year ends, which is why a chart of closes understates how volatile it has been.
- The rand trades around the clock, but its deepest liquidity is during the London session. Gaps at the Monday open are common after weekend news.
- A weaker rand raises the rand value of offshore assets, which is why offshore exposure has historically worked as a hedge for South African investors.
To put these figures to work, the Currency Converter runs the arithmetic on your own numbers, and Cross Rate Calculator covers the same ground in ordinary language. Why is the rand weak? and SARB Repo Rate History go into the detail this table only summarises. The Exchange Control Allowances covers the part this table leaves out.
Put this table on your own site
The table below can sit on your own page and stays current without you editing anything.
- Preview the embeddable table as it will appear on your site
Paste the snippet below into your own page and the table appears there, updating itself as the figures change.
<iframe src="https://www.tradeanswers.co.za/embed/ref-rand-exchange-rate-history.html" width="100%" height="620" style="border:0" title="Rand Exchange Rate History"></iframe>Free to use with attribution. The link back to this page is built into the embed.
Terms used on this page
Frequently asked questions
What drives the rand most?
The interest rate differential and global risk appetite move it within seconds. Commodity prices and the current account work over weeks and quarters.
Why is the rand so volatile?
It is deeply traded, freely floating, and tied to commodity cycles. That combination gives it emerging market risk with developed market liquidity.
Does a weak rand help the JSE?
It helps the rand hedges, which are most of the Top 40 by earnings. It hurts domestic earners like retailers and banks.
What was Nenegate?
The December 2015 removal of the finance minister, which took the rand from about R14.50 to R16.90 against the dollar within days.
Is the year-end rate representative?
No. It is a snapshot, and the intra-year range is usually wider than the gap between two year ends.
Where can I see live rates?
Any broker platform or the Reserve Bank's published rates. The Bank publishes the official closing rates used for valuation.