What this page covers
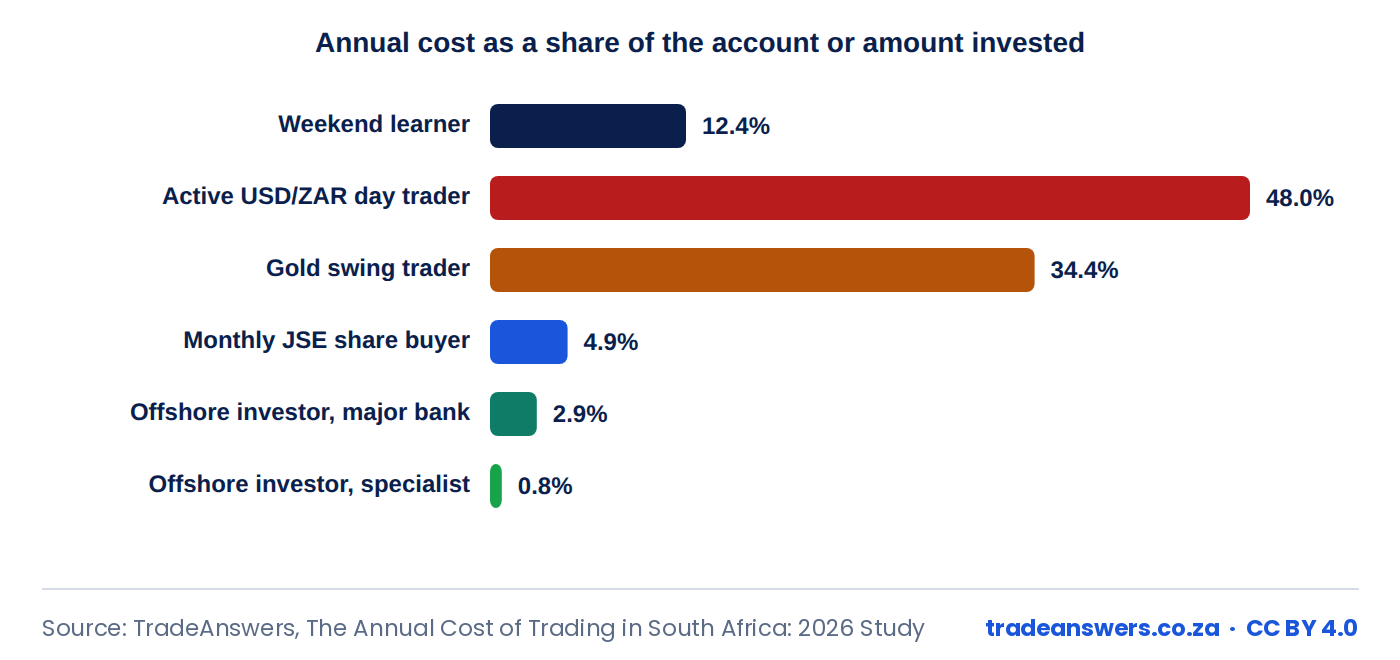
Quick answer: Trading costs are small per trade and large per year. In this 2026 study an active USD/ZAR day trader with R50,000 pays about R24,000 a year in spreads alone, 48% of the account, before a single losing trade. A weekend learner with R10,000 pays about 12%, and someone buying R2,000 of JSE shares a month loses 4.9% of what they invest to costs.
The study prices one year of activity for six typical South African traders and investors, using the cost schedules published on this site and typical retail pricing for CFDs. Every assumption is listed, the raw figures can be downloaded as a CSV, and the tables can be reused with attribution.
Key findings
- An active USD/ZAR day trader with a R50,000 account pays about R24,000 a year in spreads, 48% of the account, at one round trip a day.
- Doubling to two round trips a day, or trading at a 200-point spread, takes the annual cost to roughly the size of the whole account.
- A gold swing trader holding positions overnight pays about R10,320 a year, 34% of a R30,000 account, and nine tenths of that is overnight financing, not spread.
- Buying R2,000 of JSE shares every month costs about R1,176 a year, 4.9% of the money invested, because the minimum brokerage applies to every small purchase.
- Sending R100,000 offshore through a major bank costs about R2,950, nearly four times the R750 a specialist provider charges.
For journalists: press summary
A TradeAnswers study of six typical South African traders and investors finds that trading costs are small per trade but large per year. An active USD/ZAR day trader with a R50,000 account pays about R24,000 a year in spreads, 48% of the account, before any losing trade.
- 48% of a R50,000 account lost to spreads by an active USD/ZAR day trader
- 4.9% of every R2,000 JSE share purchase lost to costs
- R2,950 to send R100,000 offshore through a major bank, against R750 through a specialist
Chart: download the PNG. Data: download the CSV. Suggested credit: “Source: TradeAnswers, The Annual Cost of Trading in South Africa: 2026 Study”, with a link to this page. Questions: contact@tradeanswers.co.za.
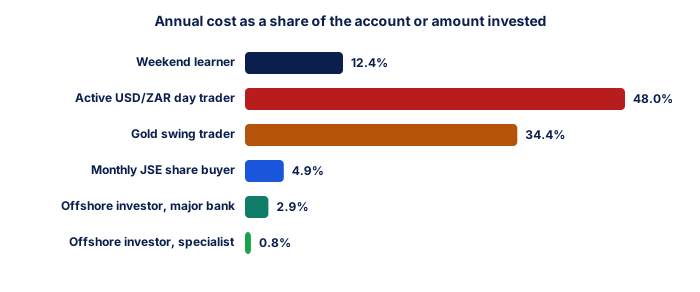
⬇ Download this chart (PNG) · Free to reuse with the credit “Source: TradeAnswers, The Annual Cost of Trading in South Africa: 2026 Study” (CC BY 4.0).
| Profile | What they do | Account or amount | Annual cost | Share of account | Where the cost comes from |
|---|---|---|---|---|---|
| Weekend learner | R10,000 CFD account, EUR/USD, 0.05 lot, 3 round trips a week | R10,000 | R1,238 | 12.4% | Spread of 1.0 pip on every round trip |
| Active USD/ZAR day trader | R50,000 CFD account, USD/ZAR, 0.1 lot, 1 round trip each trading day | R50,000 | R24,000 | 48.0% | Spread of 100 points (R0.01) on every round trip |
| Gold swing trader | R30,000 CFD account, gold, 0.02 lot, 2 trades a week held 4 nights | R30,000 | R10,320 | 34.4% | Spread $0.30 an ounce (R990) plus overnight financing at 6% a year (R9,330) |
| Monthly JSE share buyer | R2,000 of JSE shares bought every month on a 0.5% brokerage, R70 minimum | R24,000 | R1,176 | 4.9% | R98 per purchase: minimum brokerage, STT, Strate and VAT |
| Offshore investor, major bank | R100,000 sent offshore once a year through a major bank | R100,000 | R2,950 | 2.9% | 2.5% rate margin plus R450 in fees |
| Offshore investor, specialist | The same R100,000 through a specialist provider | R100,000 | R750 | 0.8% | 0.5% rate margin plus R250 in fees |
Source: TradeAnswers, The Annual Cost of Trading in South Africa: 2026 Study. Free to reuse with attribution (CC BY 4.0).
| Spread (points) | Round trips a day | Annual cost | Share of account |
|---|---|---|---|
| 50 | 1 | R12,000 | 24% |
| 50 | 2 | R24,000 | 48% |
| 100 | 1 | R24,000 | 48% |
| 100 | 2 | R48,000 | 96% |
| 150 | 1 | R36,000 | 72% |
| 150 | 2 | R72,000 | 144% |
| 200 | 1 | R48,000 | 96% |
| 200 | 2 | R96,000 | 192% |
TradeAnswers · CC BY 4.0
| Item | Value used | Why |
|---|---|---|
| Exchange rate | R16.50 to the dollar | Close to late-October 2026 levels |
| Gold price | $4,300 an ounce | Close to late-September 2026 levels |
| Trading year | 240 trading days, 50 weeks | Allows for holidays and time off |
| EUR/USD spread | 1.0 pip | A typical standard-account spread |
| USD/ZAR spread | 100 points (R0.01) | A typical retail spread outside the busiest hours; see the sensitivity table |
| Gold spread | $0.30 an ounce | A typical retail spread |
| Overnight financing on gold | 6% a year of position value | Roughly the US rate plus a broker mark-up |
| JSE purchase cost | R98 on R2,000 | From the The Annual Cost of Trading in South Africa: 2026 Study on this site |
| Offshore transfer | 2.5% margin plus R450 (bank), 0.5% plus R250 (specialist) | From the Forex Transfer Costs Reference on this site |
TradeAnswers · CC BY 4.0
How these figures work
Each profile is priced over one trading year. For CFDs the cost is the spread paid on every round trip, the difference between the buy and sell price, plus overnight financing for positions held past the daily rollover. Commissions, slippage, deposit and withdrawal fees and currency conversion are not included, so the real cost is usually higher than shown.
The JSE profile uses the cost of a R2,000 purchase from the JSE Trading Cost Schedule: the R70 minimum brokerage, securities transfer tax, settlement fees and VAT. The offshore profiles use the bank and specialist-provider routes in the Forex Transfer Costs Reference. The key driver for active traders is not the size of each cost but how often it is paid.
A worked example
A USD/ZAR position of 0.1 lot is $10,000. A 100-point spread is R0.01 per dollar, so every round trip costs 10,000 × R0.01 = R100. One round trip on each of 240 trading days is R24,000, 48% of a R50,000 account.
To break even before costs, that trader needs a gross profit of R24,000 a year just to stand still, or R100 a day. Most retail traders do not make that, which is part of why most traders lose money.
✕ Common mistakes
- Judging cost per trade instead of per year. R100 looks small; R24,000 a year does not.
- Ignoring overnight financing. For positions held for days, financing usually costs more than the spread.
- Buying shares in very small amounts. The minimum brokerage turns a R2,000 purchase into a 4.9% cost.
- Sending money offshore through the default bank route. The exchange rate margin is the real fee and it is not shown on the statement.
Notes on reading these figures
- Spreads widen in quiet hours, around news and at the daily rollover, so active traders often pay more than the averages used here.
- Costs are shown before tax. Trading losses, including costs, may reduce taxable trading income.
- A lower-cost broker or account type changes the figures; the sensitivity table shows how quickly they move.
The Trading Cost Calculator and the Broker Cost Comparison Calculator run the same arithmetic on your own numbers, and hidden fees when trading in South Africa lists the costs this study leaves out.
See also: How Do Brokers Profit From Fees?, What Is a Spread in Trading? and How Many Retail CFD Traders Lose Money? What Brokers Disclose in 2026.
Spotted an outdated figure? If a figure or rate on this page no longer matches its source, email us the page and the source. A material correction is dated on the Updates Log.
How these figures are compiled, checked and corrected: our data methodology.
Cite this page
Barosso, G. (2026, November 2). The Annual Cost of Trading in South Africa: 2026 Study. TradeAnswers. https://www.tradeanswers.co.za/annual-cost-of-trading-south-africa.htmlBarosso, G (2026) The Annual Cost of Trading in South Africa: 2026 Study, TradeAnswers, figures current at 2 November 2026, https://www.tradeanswers.co.za/annual-cost-of-trading-south-africa.htmlThe tables and the CSV on this page are free to reuse under a CC BY 4.0 licence: attribution with a link to this page. See the Press & Data Licence page.
Frequently asked questions
How much does trading cost a year in South Africa?
It depends on how often you trade. In this study the annual cost ranges from about 0.8% of the amount for a once-a-year offshore investor using a specialist provider to 48% of the account for an active USD/ZAR day trader.
What is the biggest trading cost for active traders?
The spread, because it is paid on every round trip. For traders who hold positions overnight, financing can be larger than the spread.
Why is buying small amounts of JSE shares expensive?
Because of the minimum brokerage. On a R2,000 purchase a R70 minimum, plus tax, settlement and VAT, comes to about R98, or 4.9%.
How can I reduce my trading costs?
Trade less often, trade during the most liquid hours, compare spreads and financing between brokers, buy shares in larger, less frequent amounts and use a specialist provider for offshore transfers.
Can I reuse these figures?
Yes. The tables and the CSV are licensed CC BY 4.0: reuse them with attribution and a link to this page. The citation box above gives the reference in APA and Harvard style.
 Download this data