What this page covers
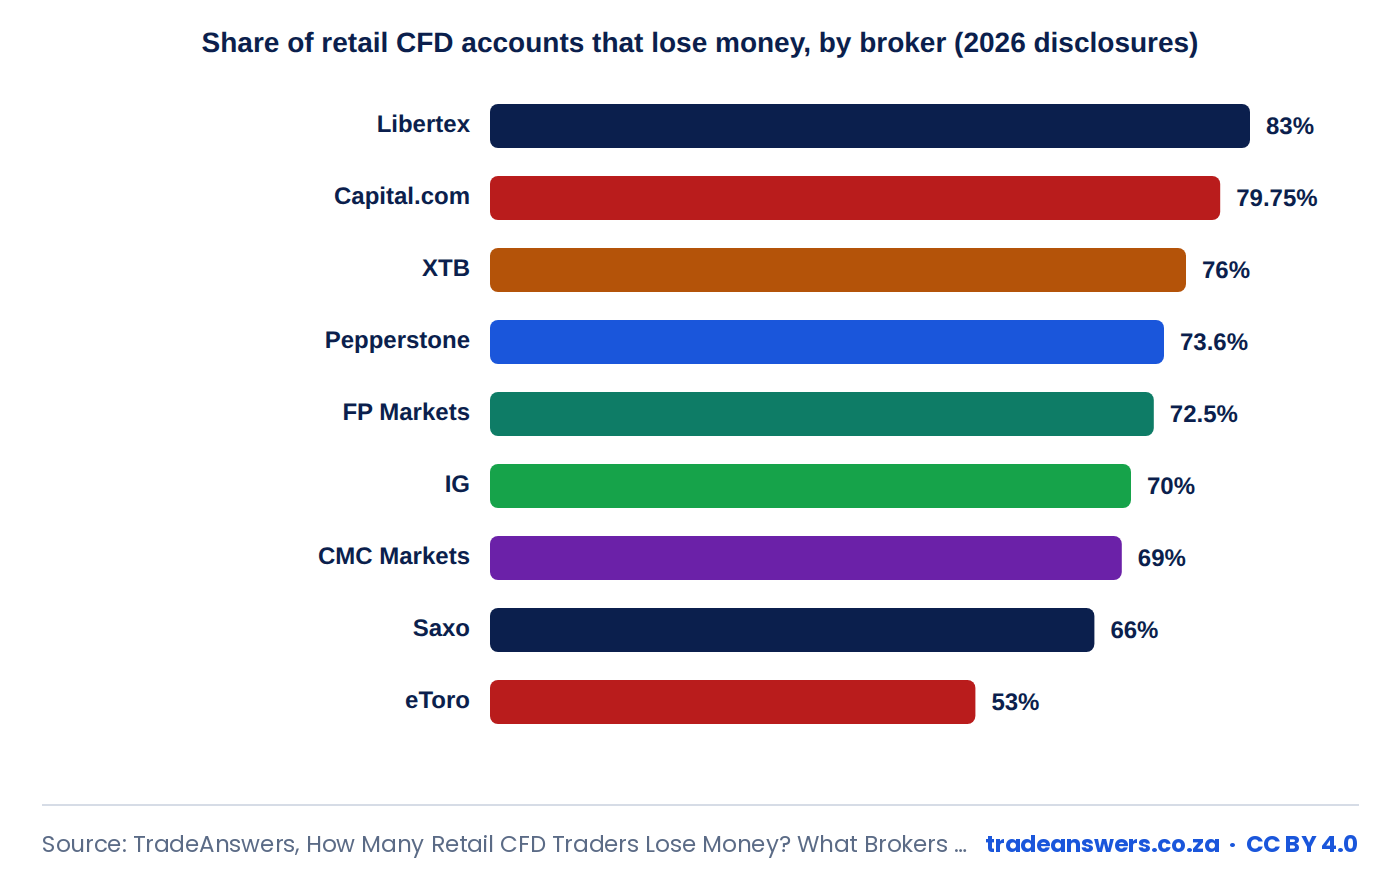
Quick answer: Across nine well-known CFD brokers, the share of retail accounts that lost money ranged from about 51% to 83% in their 2026 risk disclosures, with an average of about 71%. In other words, roughly seven in ten retail CFD traders lose money over a year, and that figure includes the costs they paid.
Brokers regulated in the European Union, the United Kingdom and several other jurisdictions must publish the percentage of their retail CFD accounts that lost money over the previous twelve months. This study collects those published figures, with the date and source of each, and explains what they measure. South African rules do not require the same standardised disclosure, so local traders often never see it.
Key findings
- Between about 51% and 83% of retail CFD accounts lost money at the nine brokers in this study, according to their own disclosures in 2026.
- The average was about 71% and the median 72.5%: roughly seven in ten retail traders lose money.
- Comparison sites that track many more brokers quote an industry range of about 52% to 86%.
- The figure counts an account as losing if its total CFD result over twelve months, including all costs and fees, is negative.
- The same broker group can publish different figures for different regulated entities, which is why some brokers show a range.
For journalists: press summary
A TradeAnswers review of 2026 risk disclosures by nine well-known CFD brokers finds that between about 51% and 83% of retail accounts lost money over twelve months, an average of about 71%, with all costs included.
- 51% to 83% of retail CFD accounts lost money at nine brokers
- 71% average: roughly seven in ten retail CFD traders lose money
- South Africa does not require the same standardised disclosure
Chart: download the PNG. Data: download the CSV. Suggested credit: “Source: TradeAnswers, How Many Retail CFD Traders Lose Money? What Brokers Disclose in 2026”, with a link to this page. Questions: contact@tradeanswers.co.za.
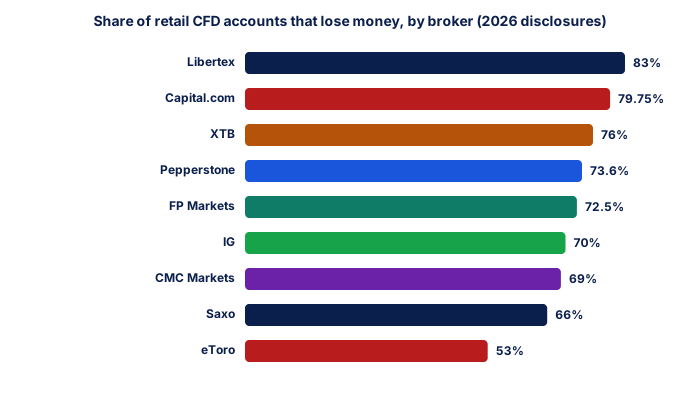
⬇ Download this chart (PNG) · Free to reuse with the credit “Source: TradeAnswers, How Many Retail CFD Traders Lose Money? What Brokers Disclose in 2026” (CC BY 4.0).
| Broker | Accounts losing money | Disclosure date | Source |
|---|---|---|---|
| Libertex | 83% | July 2026 | Libertex release, GlobeNewswire |
| Capital.com (Bahamas entity) | 79.75% | October 2026 | Broker disclosure, cited by economies.com |
| XTB | 74% to 78% | July 2026 | XTB education pages |
| Pepperstone (UK) | 73.6% | October 2026 | Broker disclosure, cited by economies.com |
| FP Markets | 72.5% | May 2026 | Broker disclosure, cited by BrokerChooser |
| IG (UK) | 70% | October 2026 | Broker disclosure, cited by economies.com |
| CMC Markets (UK) | 69% | October 2026 | Broker disclosure, cited by economies.com |
| Saxo | 66% | 2026 | Saxo CFD product page |
| eToro | 51% to 55% | September 2026 | eToro risk page |
Source: TradeAnswers, How Many Retail CFD Traders Lose Money? What Brokers Disclose in 2026. Free to reuse with attribution (CC BY 4.0).
| Measure | Value |
|---|---|
| Brokers in the study | 9 |
| Lowest figure | 51% (eToro, lower end of its range) |
| Highest figure | 83% (Libertex) |
| Average (midpoint used for ranges) | 71.4% |
| Median | 72.5% |
| Industry range quoted by comparison sites | About 52% to 86% |
TradeAnswers · CC BY 4.0
| Item | Rule |
|---|---|
| Who must publish it | CFD providers regulated in the EU, UK and several other jurisdictions |
| Period | The previous 12 months, usually updated every quarter |
| A losing account | Total realised and unrealised CFD profit over the period is negative, after all costs, fees and commissions |
| Which accounts | Retail client accounts only; professional clients are excluded |
| South Africa | Not required in the same standardised form by FSCA rules |
TradeAnswers · CC BY 4.0
How these figures work
Each broker publishes its own figure in a risk warning that usually reads: "X% of retail investor accounts lose money when trading CFDs with this provider". The rule was introduced by the European Securities and Markets Authority in 2018 and copied by the UK and other regulators. The figure covers the previous twelve months and must be kept up to date, typically every quarter.
An account counts as losing if its total CFD result over the period is negative after every cost, so the figure captures both bad trades and the drag of spreads, financing and commissions described in the annual cost of trading study. The study records each figure with its date and source; where a broker shows a range on its own site, the midpoint is used for the average.
What it means for South African traders
Most South Africans trade CFDs through a broker's South African or offshore entity, which is not required to publish the figure in the same standardised way. The disclosures from the same groups' EU and UK entities are the best available evidence of how retail clients actually fare, and there is no reason to expect better results locally.
Before opening an account it is worth checking the broker's FSCA licence and regulation and reading the group's published loss figure. The answer to why most beginners lose money usually comes down to leverage, costs and over-trading rather than a lack of strategies.
✕ Common mistakes
- Reading a lower figure as a recommendation. Loss rates depend on a broker's client mix and products, not only on its pricing.
- Assuming you will be in the minority that profits. Most people who open a CFD account expect to; the figures show most do not.
- Ignoring the 12-month window. A profitable month or quarter does not change the yearly picture.
Notes on reading these figures
- Figures are as published on the dates shown and change every quarter; check the broker's current risk warning before relying on one.
- Some figures were collected from comparison or review sites quoting the broker's disclosure; the source column says which.
- A broker group's figures differ by regulated entity, so the figure for the entity you would actually use may differ.
The risk of ruin calculator and the leverage calculator show how quickly leverage turns a run of losses into a lost account, and whether forex trading is legal in South Africa covers the local rules.
See also: Why Do Most Beginner Traders Lose Money? and The Annual Cost of Trading in South Africa: 2026 Study.
Spotted an outdated figure? If a figure or rate on this page no longer matches its source, email us the page and the source. A material correction is dated on the Updates Log.
How these figures are compiled, checked and corrected: our data methodology.
Cite this page
Barosso, G. (2026, November 2). How Many Retail CFD Traders Lose Money? What Brokers Disclose in 2026. TradeAnswers. https://www.tradeanswers.co.za/how-many-cfd-traders-lose-money.htmlBarosso, G (2026) How Many Retail CFD Traders Lose Money? What Brokers Disclose in 2026, TradeAnswers, figures current at 2 November 2026, https://www.tradeanswers.co.za/how-many-cfd-traders-lose-money.htmlThe tables and the CSV on this page are free to reuse under a CC BY 4.0 licence: attribution with a link to this page. See the Press & Data Licence page.
See also: The Annual Cost of Trading in South Africa: 2026 Study.
Frequently asked questions
What percentage of CFD traders lose money?
At the nine brokers in this study, between about 51% and 83% of retail accounts lost money in their 2026 disclosures, with an average of about 71%.
What does "retail investor accounts lose money" mean?
It means the account's total CFD result over the previous twelve months, including all costs and fees, was negative.
Do South African brokers publish this figure?
South African rules do not require the same standardised disclosure, so many local entities do not show it. The figures published by the same groups' EU and UK entities are the closest evidence.
Is a broker with a lower figure better?
Not necessarily. The figure reflects the broker's client mix and products as well as its pricing. It is one data point, not a recommendation.
Can I reuse these figures?
Yes. The tables and the CSV are licensed CC BY 4.0: reuse them with attribution and a link to this page. The citation box gives the reference in APA and Harvard style.
 Download this data