What this page covers
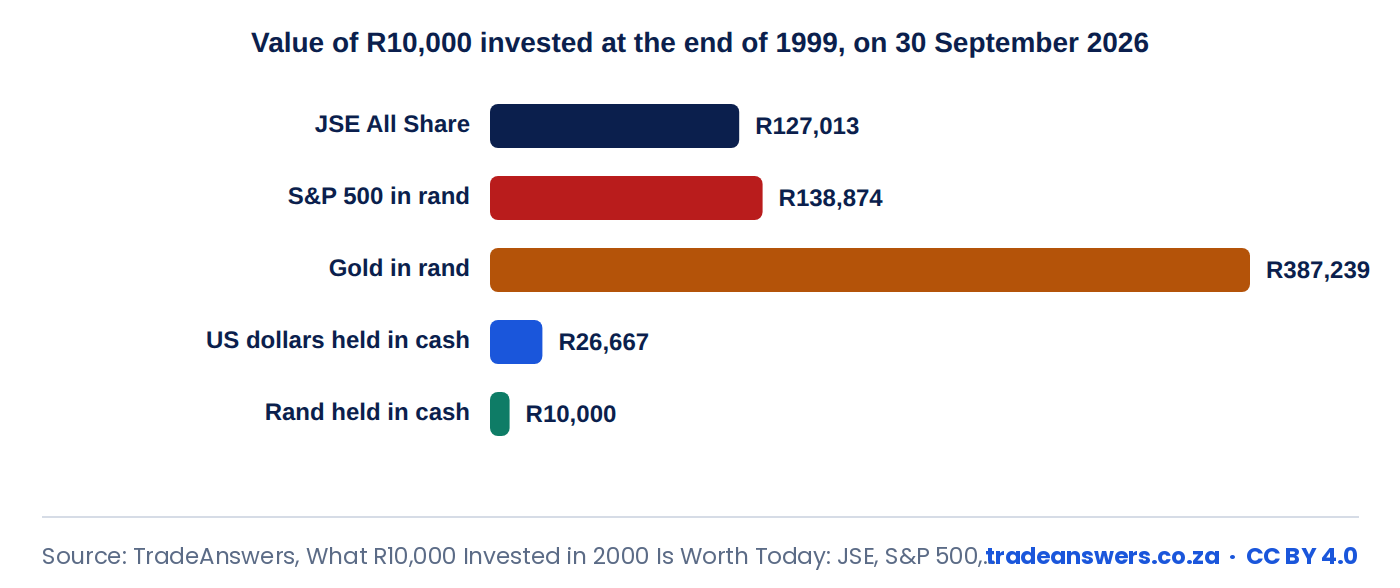
Quick answer: R10,000 put into gold at the end of 1999 was worth about R387,239 on 30 September 2026, against R138,874 in the S&P 500 and R127,013 in the JSE All Share, measured in rand on prices alone. The same R10,000 kept as cash buys only what R2,438 bought in 1999.
The study values R10,000 invested on the last trading days of 1999 in five places, using published index levels, the gold price and the rand-dollar exchange rate on both dates, and adjusts the results for South African inflation. It is a price-only comparison: dividends and interest are excluded, which the notes below explain.
Key findings
- Gold was the best performer: R10,000 became about R387,239, 38.7 times the original amount, or 14.6% a year in rand.
- The S&P 500 in rand turned R10,000 into about R138,874 and the JSE All Share into about R127,013, on prices alone.
- The rand fell from about R6.15 to R16.40 to the dollar, which multiplied every rand-measured return on an offshore asset by 2.67.
- South African prices rose about 4.1 times, so it takes about R41,012 today to buy what R10,000 bought at the end of 1999.
- R10,000 kept as rand cash with no interest buys only what R2,438 bought in 1999; even US dollars held in cash lost purchasing power, ending at about R6,502 in 1999 rand.
For journalists: press summary
A TradeAnswers study finds that R10,000 invested in gold at the end of 1999 was worth about R387,000 in rand by September 2026, against about R139,000 in the S&P 500 and R127,000 in the JSE All Share, on prices alone. The same R10,000 kept as cash now buys what about R2,400 bought in 1999.
- R387,239 from R10,000 in gold, measured in rand
- R41,012 needed today to buy what R10,000 bought at the end of 1999
- 2.67 times: the effect of the weaker rand on every offshore return
Chart: download the PNG. Data: download the CSV. Suggested credit: “Source: TradeAnswers, What R10,000 Invested in 2000 Is Worth Today: JSE, S&P 500, Gold and Cash in Rand”, with a link to this page. Questions: contact@tradeanswers.co.za.
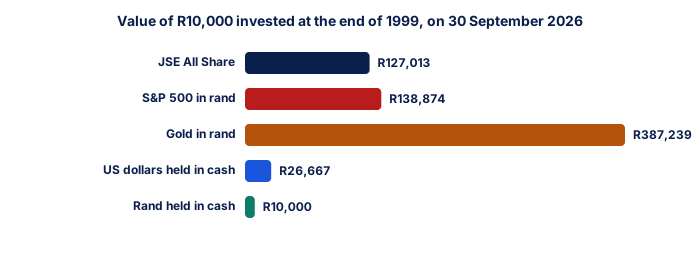
⬇ Download this chart (PNG) · Free to reuse with the credit “Source: TradeAnswers, What R10,000 Invested in 2000 Is Worth Today: JSE, S&P 500, Gold and Cash in Rand” (CC BY 4.0).
| Investment | Value in rand | Multiple | Annual return in rand | Value after inflation (1999 rand) | Real annual return |
|---|---|---|---|---|---|
| JSE All Share (price index) | R127,013 | 12.7x | 10.0% | R30,970 | 4.3% |
| S&P 500 in rand (price index) | R138,874 | 13.9x | 10.3% | R33,862 | 4.7% |
| Gold in rand | R387,239 | 38.7x | 14.6% | R94,422 | 8.8% |
| US dollars held in cash | R26,667 | 2.7x | 3.7% | R6,502 | -1.6% |
| Rand held in cash, no interest | R10,000 | 1.0x | 0.0% | R2,438 | -5.1% |
Source: TradeAnswers, What R10,000 Invested in 2000 Is Worth Today: JSE, S&P 500, Gold and Cash in Rand. Free to reuse with attribution (CC BY 4.0).
| Measure | End of 1999 | 30 September 2026 | Source |
|---|---|---|---|
| JSE All Share index | 8,543 (29 December 1999) | 108,506.88 | JSE; Q3 2026 market review |
| S&P 500 index | 1,469.25 (31 December 1999) | 7,651.54 | S&P Dow Jones Indices; CNBC |
| Gold, US dollars an ounce | $290.25 | $4,214.85 (spot, 03:40 New York time) | Year-end London price; Natural Resource Stocks |
| Rand per US dollar | R6.15 | R16.40 | South African Reserve Bank; market data |
| South African prices | Index 1.00 | About 4.10 | Statistics South Africa, compounded annual averages |
TradeAnswers · CC BY 4.0
| Step | Method |
|---|---|
| Index investments | R10,000 multiplied by the end index level over the start level |
| Offshore assets | Dollar return multiplied by the change in the rand-dollar rate |
| Inflation | Annual average CPI for 2000 to 2025 compounded, then January to September 2026 from the Stats SA index |
| Annual return | Compound annual growth over 26.75 years |
| Exclusions | Dividends, interest, costs and taxes |
TradeAnswers · CC BY 4.0
How these figures work
Each investment starts at R10,000 at the end of 1999 and is valued on 30 September 2026. For the JSE the value follows the All Share index; for the S&P 500 and gold it follows the dollar price, converted to rand at the exchange rate on each date. US dollar cash shows the effect of the exchange rate alone, and rand cash shows what happens to money that earns nothing.
Real values divide each result by the rise in South African prices, using the inflation history on this site. The rand exchange rate history shows the path the rand took between the two dates, which mattered as much as the assets themselves.
A worked example
The S&P 500 rose from 1,469.25 to 7,651.54, a multiple of 5.21 in dollars. Over the same period the rand weakened from R6.15 to R16.40 to the dollar, a multiple of 2.67. In rand the investment therefore grew 5.21 × 2.67 = 13.9 times, turning R10,000 into about R138,874.
After South African inflation of about 4.1 times, that is worth about R33,862 in end-1999 money, a real return of 4.7% a year. The inflation calculator runs the same adjustment on any amount.
✕ Common mistakes
- Comparing price returns with total returns. These figures exclude dividends; with dividends reinvested, both share indices would be worth considerably more, and the JSE has historically paid a higher dividend yield than the S&P 500.
- Ignoring the currency. Most of the rand return on offshore assets came from the weaker rand, not only from the assets.
- Treating one period as a forecast. Gold started this period near a 20-year low; a different start date gives a different ranking.
Notes on reading these figures
- Price indices exclude dividends. Total-return versions of both share indices would show substantially higher values.
- Cash earning interest in a bank or money market fund would have done far better than the no-interest rand cash shown, which is included to show the effect of inflation alone.
- Costs, taxes and exchange control are ignored; investing offshore in 1999 also required exchange control approval that individuals did not generally have.
The compound growth calculator and the CAGR calculator work out growth on your own figures, and how to invest in gold in South Africa and how to invest in ETFs cover the practical routes.
See also: Rand Exchange Rate History and South African Inflation (CPI) History.
Spotted an outdated figure? If a figure or rate on this page no longer matches its source, email us the page and the source. A material correction is dated on the Updates Log.
How these figures are compiled, checked and corrected: our data methodology.
Cite this page
Barosso, G. (2026, November 2). What R10,000 Invested in 2000 Is Worth Today: JSE, S&P 500, Gold and Cash in Rand. TradeAnswers. https://www.tradeanswers.co.za/what-r10000-invested-in-2000-is-worth-today.htmlBarosso, G (2026) What R10,000 Invested in 2000 Is Worth Today: JSE, S&P 500, Gold and Cash in Rand, TradeAnswers, figures current at 2 November 2026, https://www.tradeanswers.co.za/what-r10000-invested-in-2000-is-worth-today.htmlThe tables and the CSV on this page are free to reuse under a CC BY 4.0 licence: attribution with a link to this page. See the Press & Data Licence page.
See also: The Annual Cost of Trading in South Africa: 2026 Study.
Frequently asked questions
What would R10,000 invested in 2000 be worth today?
Measured from the end of 1999 to 30 September 2026, about R387,239 in gold, R138,874 in the S&P 500 and R127,013 in the JSE All Share, in rand and on prices alone.
Did gold beat shares since 2000?
In this period, yes, on price alone. Gold started near a 20-year low in 1999, which favours it. Shares also paid dividends, which this comparison leaves out.
How much has inflation reduced the value of R10,000 since 2000?
South African prices rose about 4.1 times, so R10,000 kept as cash now buys what about R2,438 bought at the end of 1999.
Does this include dividends?
No. The share figures use price indices. With dividends reinvested both indices would be worth considerably more.
Can I reuse these figures?
Yes. The tables and the CSV are licensed CC BY 4.0: reuse them with attribution and a link to this page. The citation box gives the reference in APA and Harvard style.
 Download this data